
Figures & data
Figure 1 Histogram of gamma distribution range and prediction values below LOD of VEGF-C.
Abbreviations: LOD, limit of detection; VEGF, vascular endothelial growth factor.
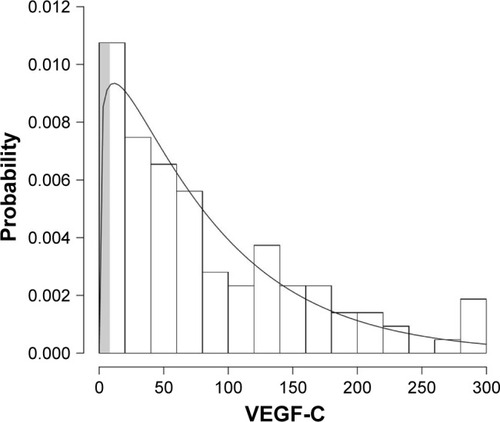
Table 1 Baseline demographic data
Table 2 Mean changes in cytokines levels (pg/dL) from baseline to visit 3
Table 3 Mean visual acuity of patient in each study group
Table S1 Mean and range of cytokine level (pg/dL) at baseline visit