
Figures & data
Figure 1 The ETDRS sectors at the posterior pole. The center circle is 1 mm, the inner circle is 1–3 mm and the outer circle is 3–6 mm.
Note: The green line corresponds to the cut section shown on the B scan.
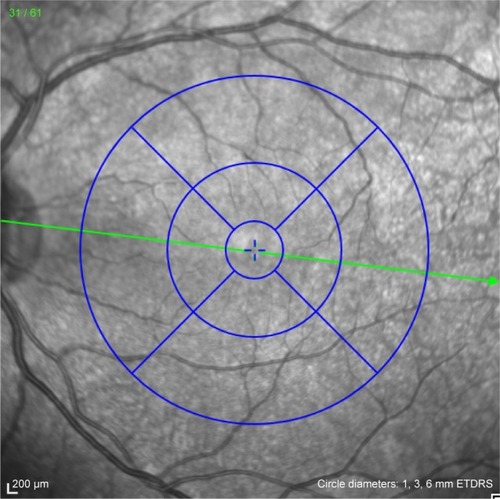
Figure 2 Retinal layers that were quantified are shown.
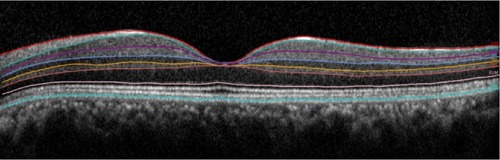
Table 1 General characteristics
Table 2 Individual retinal layer thickness stratified by the ETDRS sectors
Table 3 The effect of gender on individual retinal layers
Table 4 The effect of age on individual retinal layers
Table 5 The effect of axial length on individual retinal layers
Table 6 The reproducibility individual retinal layer measurements