Figures & data
Table 1 Patient characteristics
Table 2 Patient IOP and visual field data
Figure 1 Visual field stages and courses.
Notes: In the initial visual field defect, stage I was most prevalent, followed by stage II (36 eyes, 27.3%) and stage III (31 eyes, 23.5%), while stage IV was absent. After 5 years, the percentage of stage I had decreased, while those of stage II, stage III and stage IV had increased.
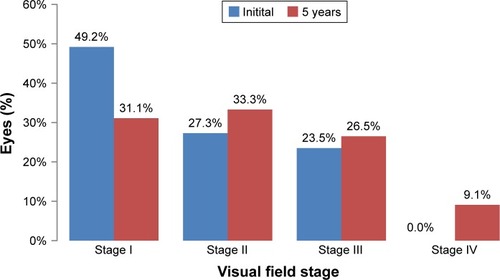
Figure 2 Transitions of visual field stages determined using a Markov model.
Notes: During the 5-year follow-up period, visual field defect progression occurred from stage I to II in 35.4% of patients, from stage II to III in 41.7%, and from stage III to IV in 38.7%. A jump in transition from stage I to III was observed in 3.1%. Transitions from stage II to I were observed in 2.8%, and from stage III to II in 3.2%.
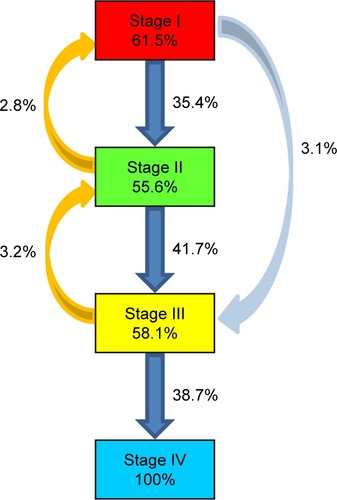
Table 3 MD slope value by IOP reduction rate at 5 years
Figure 3 Associations between visual field stage transitions and IOP reductions.
Notes: With regard to visual field stage transitions, when the IOP reduction cut-off values were 10%, 15%, 20%, and 30%, no significant differences were found. However, visual field stage transitions from stage I to II occurred in 40.0% and 20.0% of patients in the groups with IOP reductions of <25% and the groups with IOP reductions of ≥25%, respectively, from stage II to III in 58.3% and 8.3%, and from stage III to IV in 36.8% and 41.7%. The probability of progression was significantly lower in the groups with IOP reductions of ≥25% than in the groups with IOP reductions of <25% (P=0.0432). *P>0.05.
Abbreviation: IOP, intraocular pressure.
Abbreviation: IOP, intraocular pressure.
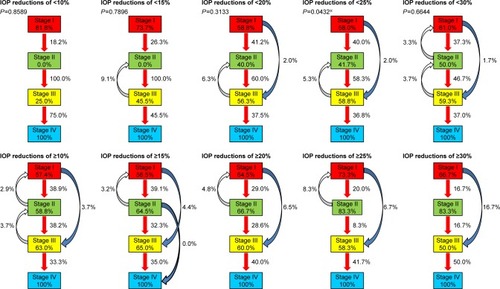
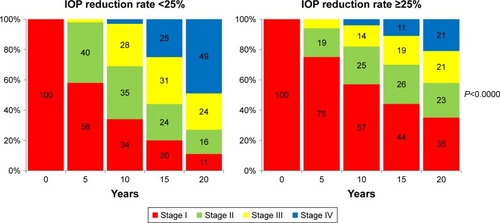
Figure 4 Simulation of visual field stage transition in the groups with IOP reduction rate of <25% and ≥25%.
Notes: Based on the groups with IOP reductions of ≥25%, the visual field stage transitions after 20 years were simulated, assuming that all patients would start treatment at stage I. The probability of transition to stage IV was higher at 49% in the groups with IOP reductions of <25% and lower at 21% in the groups with IOP reductions of ≥25%. This difference was significant (P>0.0000).
Abbreviation: IOP, intraocular pressure.
Abbreviation: IOP, intraocular pressure.