
Figures & data
Table 1 Sections of the first survey
Table 2 Questions of the second survey
Figure 1 Age classification.
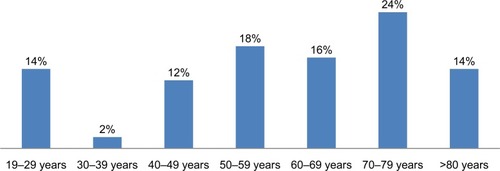
Figure 2 Years of visual impairment.
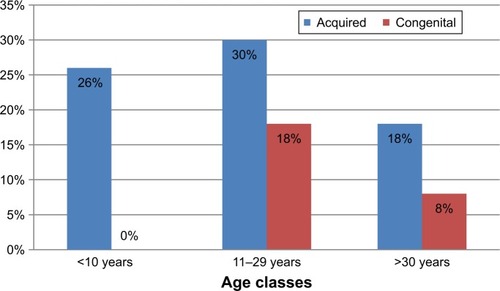
Figure 3 Causes of visual impairment.
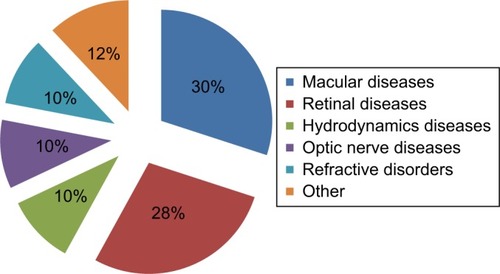
Figure 4 Macular diseases.
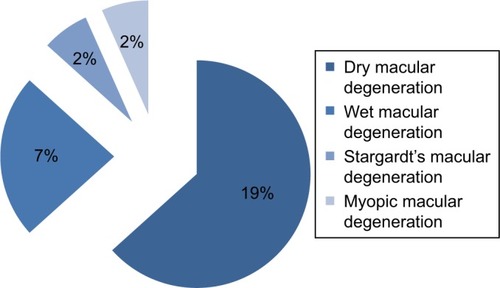
Figure 5 Retinal diseases.
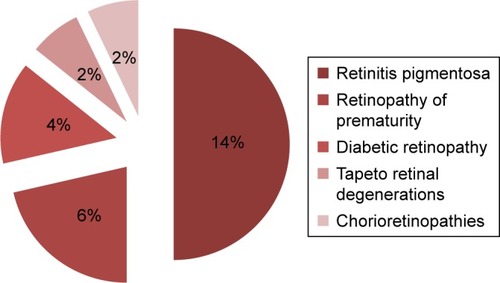
Figure 6 Hydrodynamics diseases.
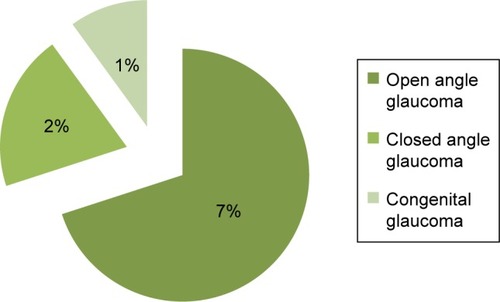
Figure 7 Optic nerve diseases.
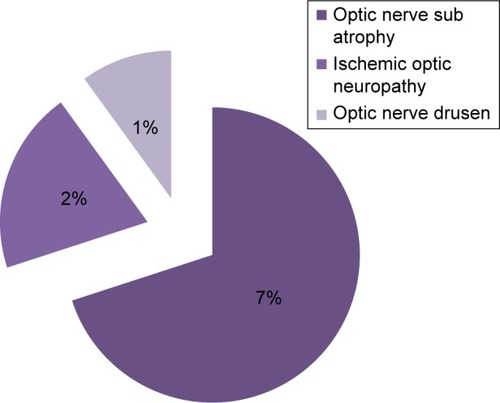
Figure 8 Refractive disorders.
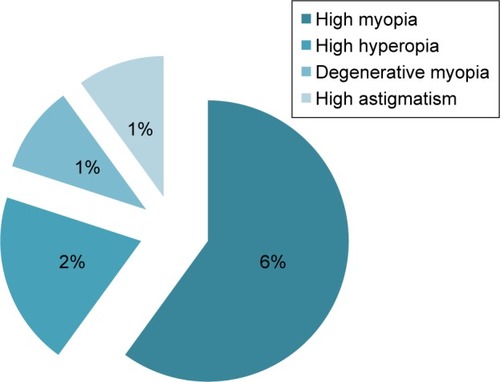
Figure 9 Other pathologies.
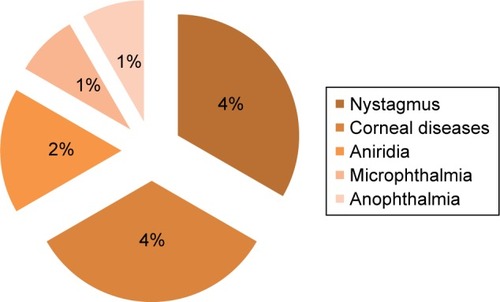
Figure 10 Degree of low vision or blindness.
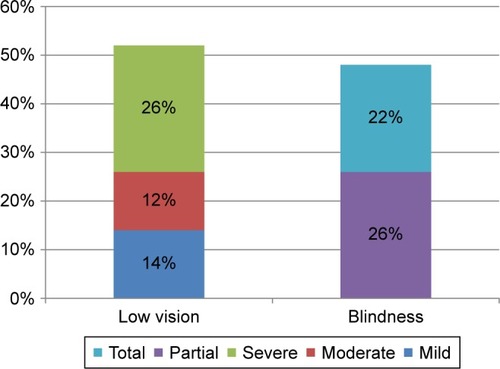
Table 3 Public places and monthly average of visits
Table 4 Public places and annual average of visits
Figure 11 Environmental aids.
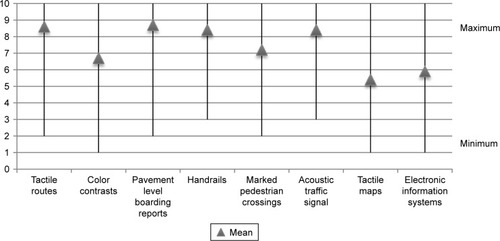
Figure 12 More used environmental aids.
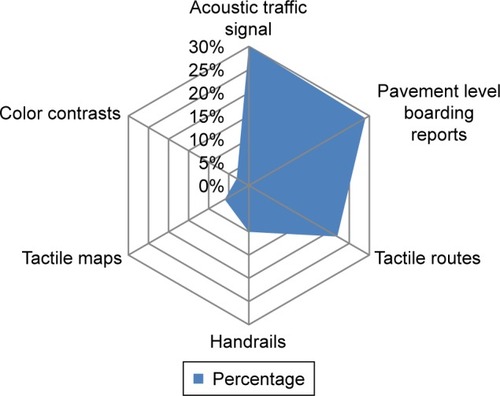
Figure 13 Less used environmental aids.
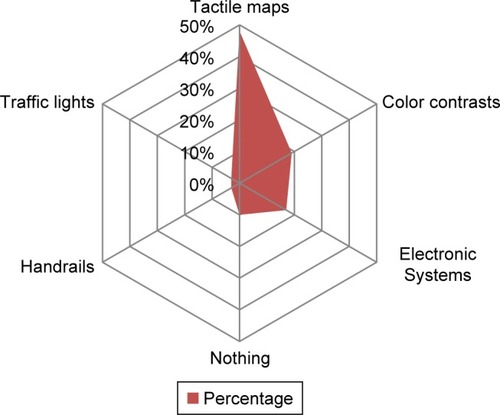
Figure 14 More required aids in Turin.
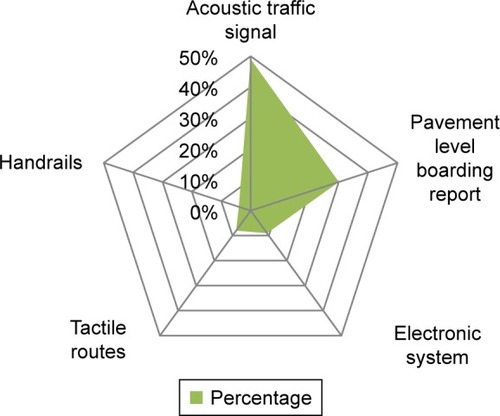
Figure 15 Signs.
Figure 16 More used signs.
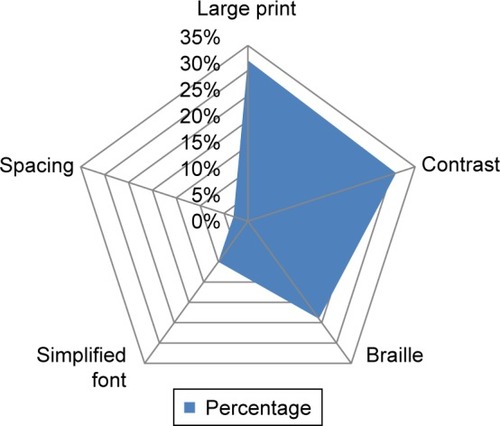
Figure 17 Less used signs.
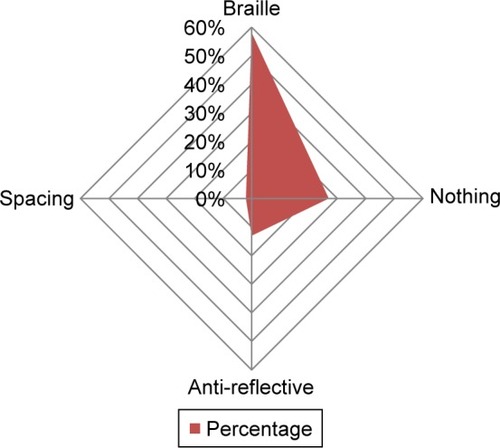
Figure 18 More required aids.
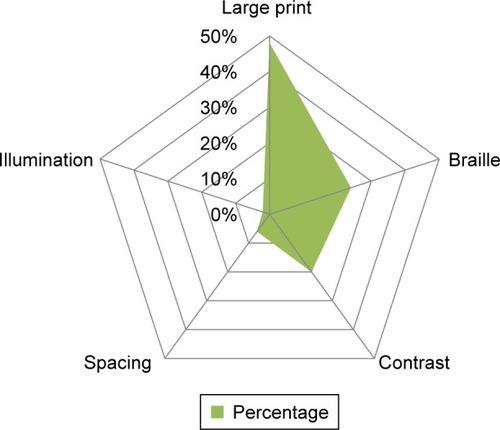
Table 5 Survey quests
Table 6 Answers of the question 10 (survey 2): what do you expect of the urban renewal project of Nizza street?