Figures & data
Table 1 Demographic characteristics in severe chronic CSC patients (cases) and nonsevere chronic CSC patients (controls)
Table 2 Treatment specifications in severe chronic CSC (cases) and nonsevere chronic CSC (controls)
Table 3 Additional treatments after initial PDT in severe chronic CSC (cases) and nonsevere chronic CSC (controls)
Figure 1 Multimodal imaging of a 71-year-old male patient with severe bilateral chronic central serous chorioretinopathy (A–F: right eye, G–L: left eye).
Abbreviations: OCT, optical coherence tomography; RPE, retinal pigment epithelial.
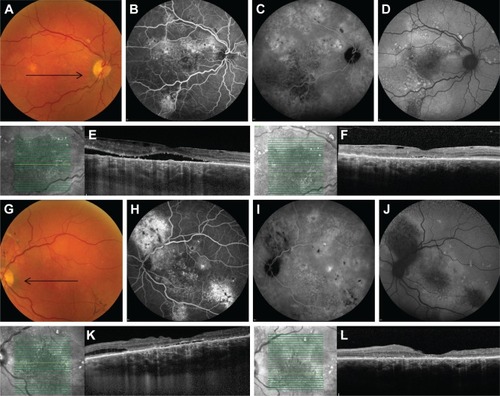
Table 4 Clinical outcome after PDT with reduced settings in severe chronic CSC (cases) and nonsevere chronic CSC (controls)
Figure 2 Kaplan–Meier curve showing the cumulative fraction of patients treated for chronic central serous chorioretinopathy (cCSC).
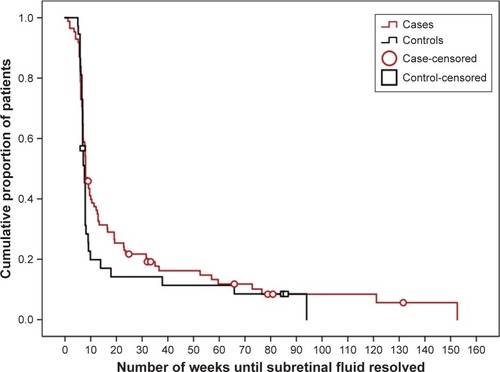
Figure 3 Clinical features on multimodal imaging of the right eye of a 63-year-old female patient with severe chronic central serous chorioretinopathy (A–C). Black arrow on color fundus photography image (A) shows the scanning plane, which is depicted on the SD-OCT scans (D, E). FAF shows multiple speckled hyperautofluorescent changes in the macula together with an irregular surface of hypoautofluorescence, expanding from the fovea to the superior and inferior vascular arcades (B). Fluorescein angiography imaging (C) revealed a limited area of fluorescein leakage with a clear central focus. The areas of hypofluorescence were located more temporal from the fovea and were smaller than on FAF. An SD-OCT scan (D) at first presentation and prior to treatment revealed a subretinal serous fluid accumulation together with a posterior cystoid retinal degeneration in the outer nuclear layer of the retina. At ~2 months after half-dose photodynamic therapy, both subretinal and intraretinal fluid on OCT had resolved completely (E).
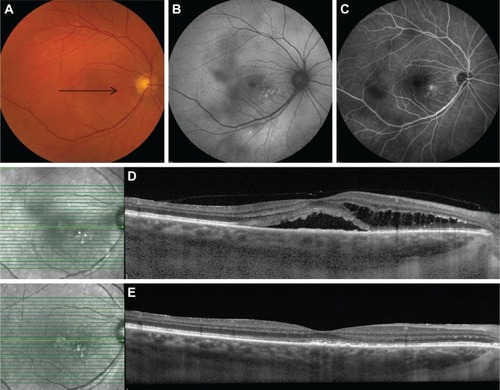
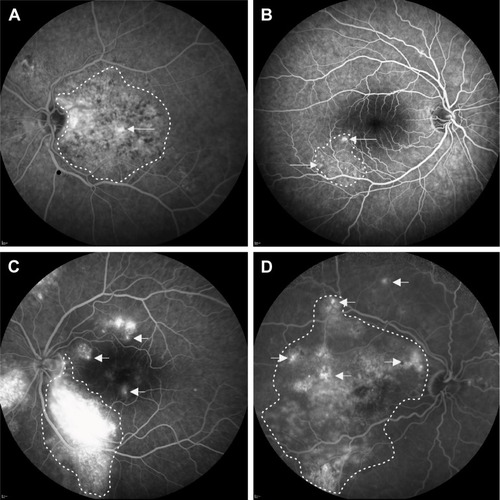
Figure 4 Four categories of eyes with severe chronic central serous chorioretinopathy with active fluorescein leakage on fluorescein angiography.
Abbreviations: DARA, diffuse atrophic RPE alterations; RPE, retinal pigment epithelium.