Figures & data
Figure 1 Intraocular pressure (IOP) before and after addition of dorzolamide.
Notes: *P < 0.0001, ANOVA and the Bonferroni/Dunnett tests.
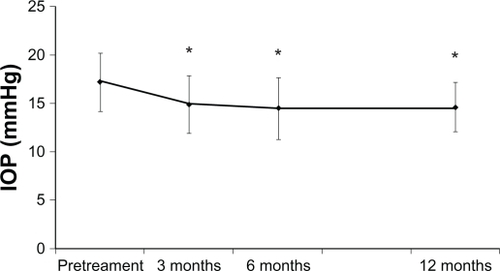
Figure 2 Mean deviation at baseline and 12 months after addition of dorzolamide.
Note: Paired t-test.
Abbreviation: NS, not significant.
Abbreviation: NS, not significant.
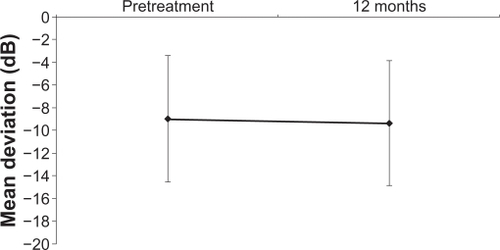
Table 1 Review of previous studies conducted outside/inside Japan