Figures & data
Table 1 Demographic data of pediatric cataract patients
Figure 1 Distribution of number of eyes from children who were ≥7 years of age.
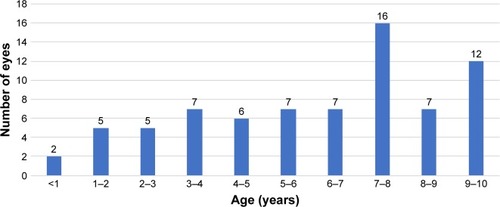
Figure 2 Distribution of the final refractive status in children >7 years of age who underwent cataract surgery with intended undercorrection of IOL power.
Abbreviation: IOL, intraocular lens.
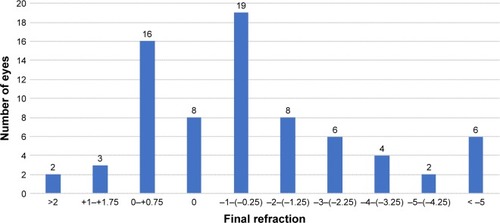
Figure 3 Distribution of postoperative best corrected visual acuity.
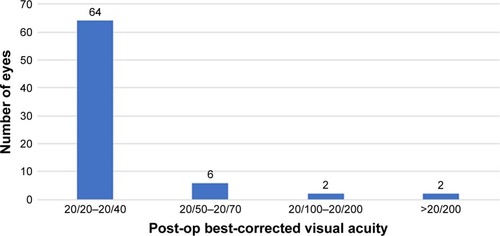
Figure 4 Distribution of mean final refraction according to age at the time of surgery.
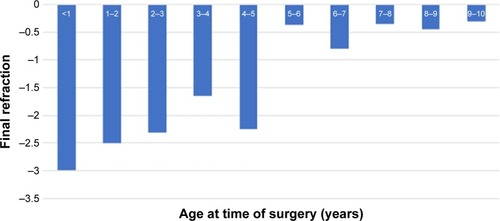
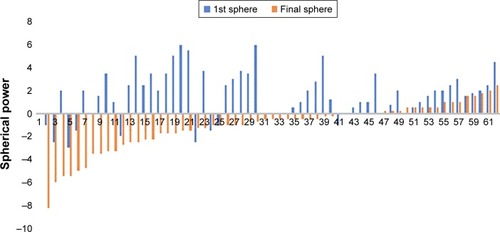
Figure 5 Postoperative initial spherical power compared with final spherical power in each study participant.