
Figures & data
Table 1 Distribution and comparison of the patients regarding gender and the operated eye in relation to the groups
Table 2 Distribution and comparison of patients regarding the variables in relation to the groups
Figure 1 Mean of IOP difference for pre- and postoperative moments in each group.
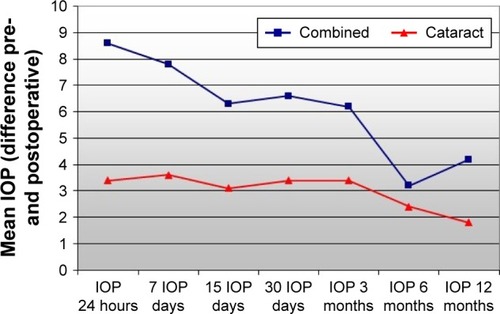
Table 3 Distribution and comparison of patients regarding the pre- and postoperative difference in IOP in relation to the groups
Table 4 Linear regression test between axial length and IOP difference (post – pre) in patients subjected to phacoemulsification
Table 5 Linear regression test between ACD and IOP difference (post – pre) in eyes that were subjected to phacoemulsification
Table 6 Linear regression test between axial length and IOP difference (post – pre) for patients who underwent trabeculectomy with phacoemulsification
Table 7 Linear regression test between ACD and difference in IOP (post – pre) for patients who underwent trabeculectomy with phacoemulsification
Table 8 Comparison between the means of the variables under study according to preoperative pressure categories for patients who underwent trabeculectomy with phacoemulsification
Table 9 Eye distribution regarding the number of classes of anti-glaucomatous medications in the pre- and postoperative period for patients who underwent trabeculectomy with phacoemulsification