
Figures & data
Figure 1 Group 1: detachments that occurred in the temporal or nasal superior region and did not exceed 12 o’clock.
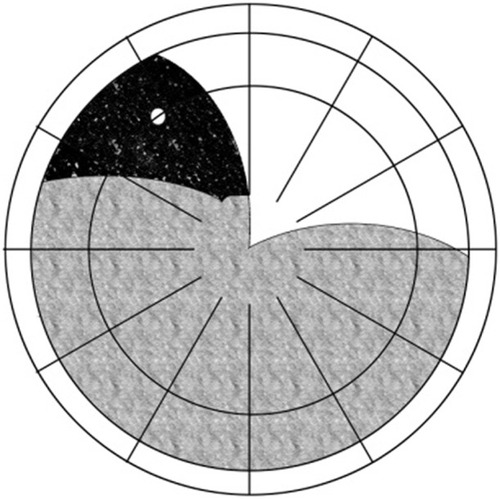
Figure 2 Superior temporal or nasal detachments that did not exceed the inferior vertical midline.
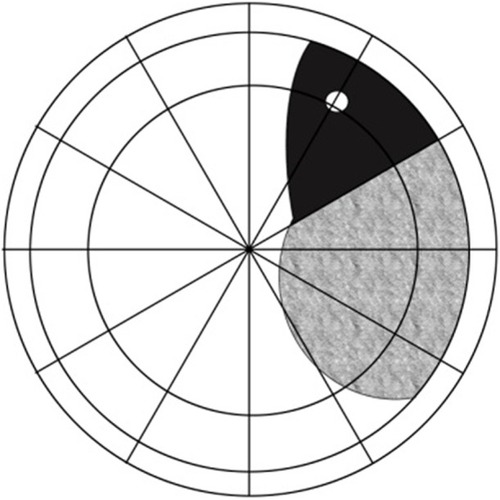
Figure 3 Group 2: shallow detachments that occurred in the inferior region.
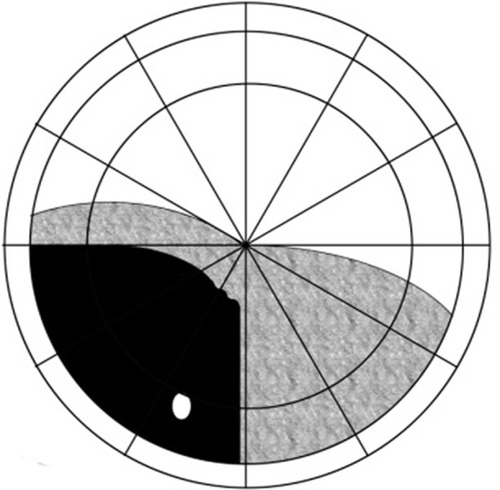
Figure 4 Group 3(A): detachments intersecting 12 o’clock.
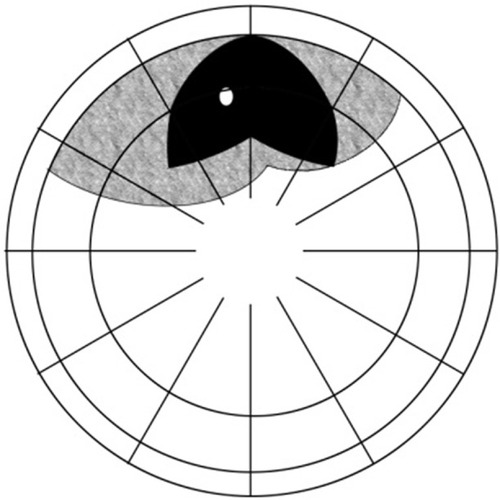
Figure 5 Group 3(B): this category is used to classify the same eyes as in Group 3 according to our different criteria for the corresponding pattern.
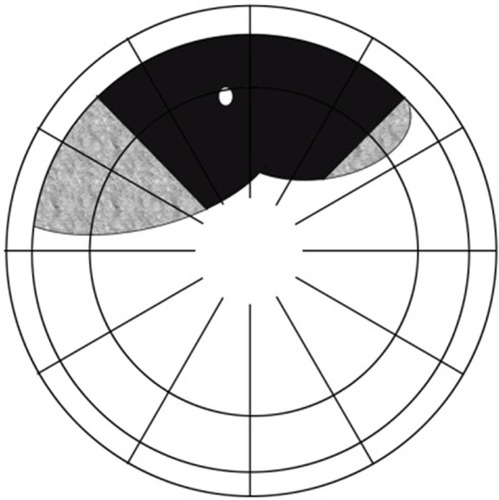
Figure 6 Group 4: symmetrical detachments.
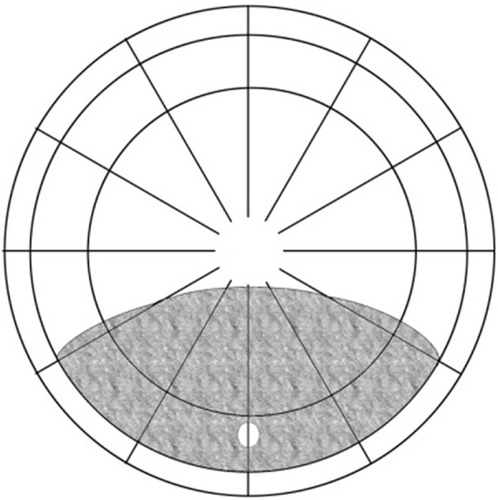
Figure 7 Group 5: inferior bullous detachments.
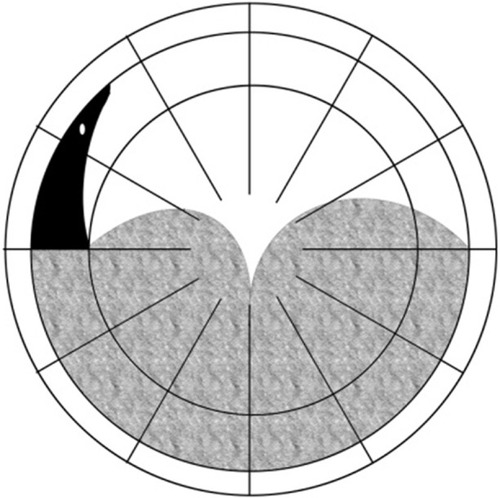
Figure 8 Group 6: detachments across both the superior vertical and horizontal midlines.
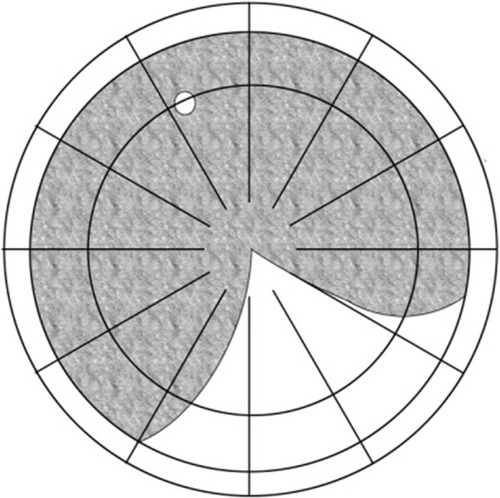
Figure 9 Group 7: almost total detachment except for a superior wedge-shaped attachment.
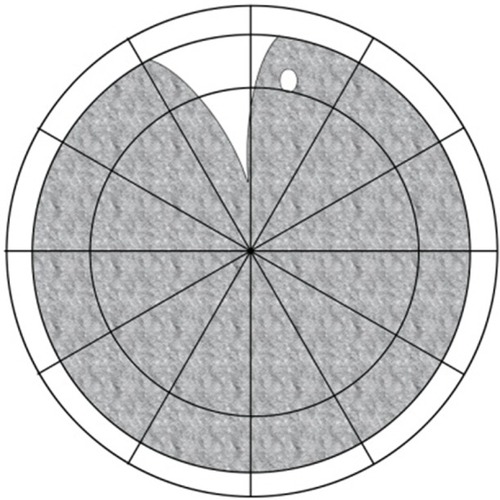
Figure 10 Group 8: total detachments.
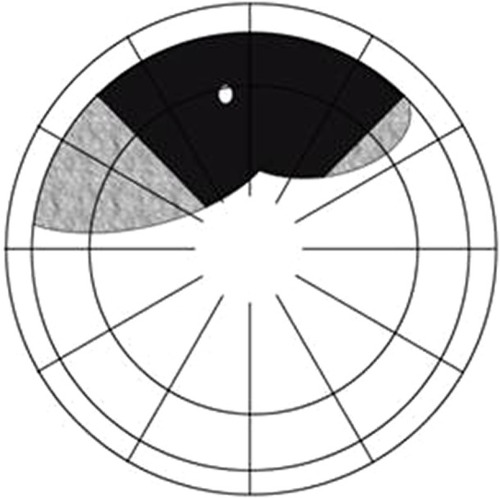
Table 1 Subjects
Table 2 Corresponding numbers between the original text and our present study
Table 3 Refractive error in the present study (only phakic eyes and those that never underwent previous cataract surgery; moreover, those in which the macula remained attached before the operation)
Table 4 Previous cataract surgery before rhegmatogenous retinal detachment and agreement rates
Table 5 The results of previous studies according to Lincoff’s report