
Figures & data
Table 1 Population demographics (n=75 eyes)
Table 2 Distribution of the percentage reduction in IOP for the whole cohort
Figure 1 Mean IOP in mmHg before surgery (blue bars) and 12 months after surgery (orange bars) for all eyes, for eyes treated with ABiC combined with phacoemulsification, and for eyes treated with stand-alone ABiC.
Abbreviations: ABiC, ab-interno canaloplasty; m, months; Phaco, phacoemulsification.
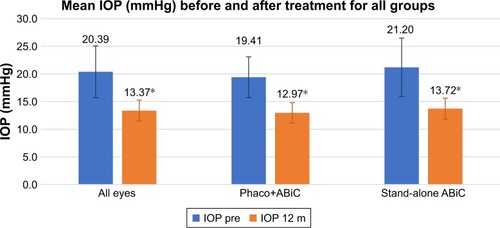
Figure 2 Mean number of medications before surgery (blue bars) and 12 months after surgery (orange bars) for all eyes, for eyes treated with ABiC combined with phacoemulsification, and for eyes treated with stand-alone ABiC.
Abbreviations: ABiC, ab-interno canaloplasty; m, months; Nb, number; Phaco, phacoemulsification.
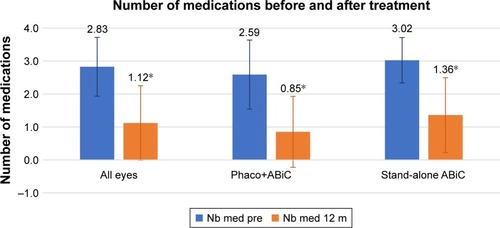
Table 3 Distribution of the percentage reduction in IOP for the combined group
Table 4 Distribution of the percentage reduction in IOP for the stand-alone group
Table 5 Mean visual acuity preoperatively and 12 months postoperatively