
Figures & data
Table 1 Minimum and maximum IOP value and mean ± SD for NCT, nGAT, fGAT
Table 2 Minimum–maximum value, mean value ± SD of CCT, refractive value, keratometric value
Figure 1 Correlation analysis of IOP (mmHg) between NCT and fGAT.
Abbreviations: fGAT, GAT with fluorescein; GAT, Goldmann, applanation tonometer; IOP, intraocular pressure; NCT, noncontact tonometer.
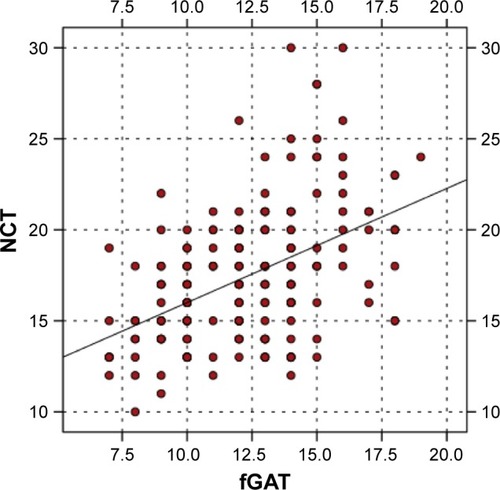
Figure 2 Correlation analysis of IOP (mmHg) between NCT and nGAT.
Abbreviations: GAT, Goldmann applanation tonometer; IOP, intraocular pressure; NCT, noncontact tonometer; nGAT, GAT without fluorescein.
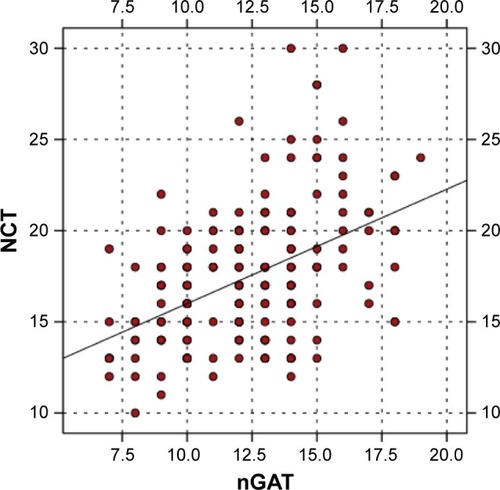
Figure 3 Bland–Altman plot of IOP (mmHg) between NCT and fGAT.
Abbreviations: fGAT, GAT with fluorescein; GAT, Goldmann, applanation tonometer; IOP, intraocular pressure; NCT, noncontact tonometer.
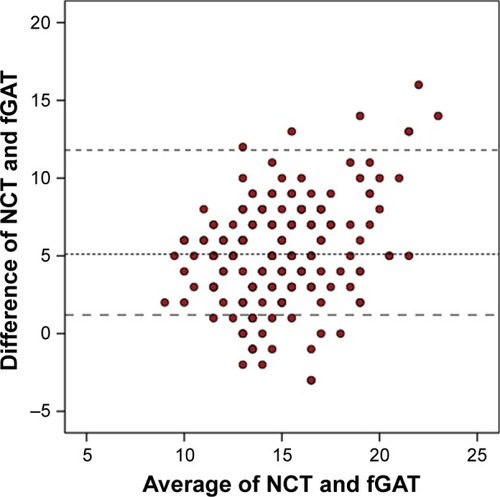
Figure 4 Bland–Altman plot of IOP (mmHg) between NCT and nGAT.
Abbreviations: GAT, Goldmann applanation tonometer; IOP, intraocular pressure; NCT, noncontact tonometer; nGAT, GAT without fluorescein.
