Figures & data
Table 1 The demographic data
Table 2 The cumulative number of patients for each group at each year
Table 3 The number of injections at each year
Table 4 The number of patients for categories of VA changes at each year
Figure 1 The BCVA changes from the baseline for the combination and anti-VEGF groups at each year.
Abbreviations: BCVA, best-corrected visual acuity; anti-VEGF, anti-vascular endothelial growth factor.
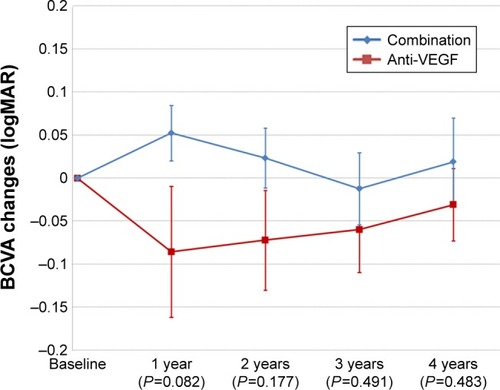
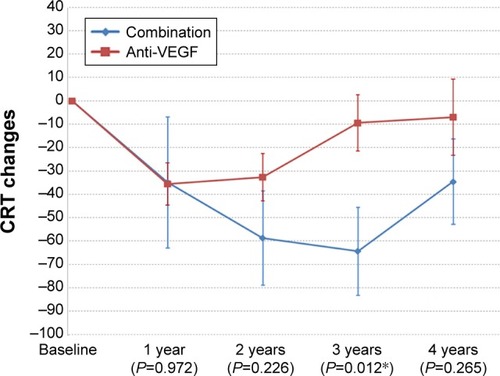
Figure 2 The CRT changes from the baseline for the combination and anti-VEGF groups at each year.
Note: *P-value with statistical significance.
Abbreviations: CRT, central retinal thickness; anti-VEGF, anti-vascular endothelial growth factor.
Abbreviations: CRT, central retinal thickness; anti-VEGF, anti-vascular endothelial growth factor.