Figures & data
Figure 1 Analyzed images.
Notes: (A) An original image cropped to 800×800 pixels centered at the central fovea from 1,024×1,024 pixels (3×3 mm) images. (B) The image was adjusted by the contrast limited adaptive histogram equalization method in the Fiji package. (C) Vessel segmentation for image B, performed with AngioTool.
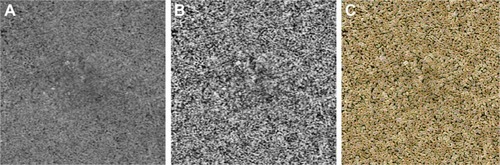
Table 1 Parameters in healthy individuals and patients’ groups
Table 2 Measurement of flow void by thresholding
Table 3 Measurement parameters and reproducibility in images treated with local contrast enhancement
Figure 2 Comparisons of the results analyzed using AngioTool, with vessel thickness 3–4 and intensity 15 between healthy individuals and the patients.
Notes: (A) Vessel area. (B) Total vessel length. (C) Vessel diameter index. (D) Mean lacunarity.
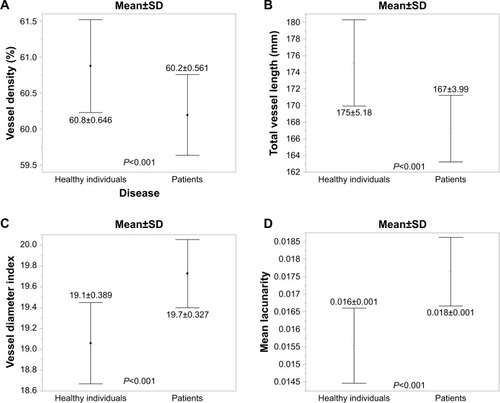
Figure 3 Regional variations of morphometrical results in healthy individuals.
Notes: (A) Assignment of the measurement zones. The square image of 800×800 pixels was divided into 64 squares (each square is100×100 pixels), and the 64 squares were assigned to four zones. (B–D) Histograms of the morphometrical measurements of each small square (100×100 pixels) in each zone are shown. (B) Vessel area. (C) Total vessel length. (D) Vessel diameter index. (E) Mean lacunarity. *P<0.05.
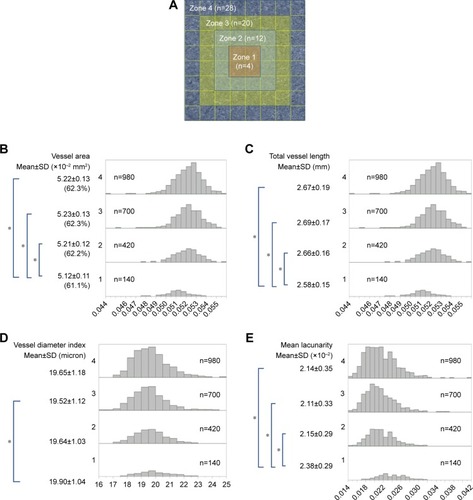
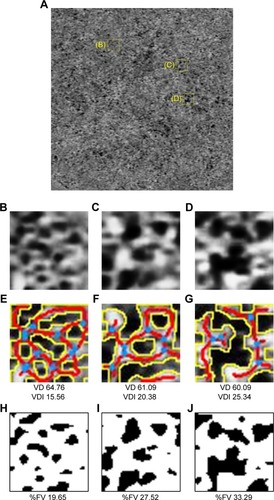
Figure 4 Morphometrical evaluation of focal lesions.
Notes: (A) An original image (800×800 pixels) of an eye with resolved central serous retinopathy. Images (B–D) correspond to the 50×50 pixel yellow-lined square B, C, and D on the image (A). Images (B–D) are contrast adjusted by contrast limited adaptive histogram equalization. (E–G) corresponding to (B–D) are segmented images from AngioTool. The measurements were performed with vessel thickness 3–4 and intensity 15. The vessel borders are outlined in yellow. The vessel skeletons are outlined in red. The blue areas represent the branching points of the vessels. (H–J), corresponding to B, C, and D lettered on image (A), are the images resulting from thresholding using Phansalkar’s method. With increasing %FV, VD decreased and VDI increased.
Abbreviations: %FV, the percentage of flow void measured on the image thresholding; VD, vessel density; VDI, vessel diameter index.
Abbreviations: %FV, the percentage of flow void measured on the image thresholding; VD, vessel density; VDI, vessel diameter index.