
Figures & data
Table 1 Patient demographics
Figure 1 Scatter plot of Day 1 and Month 12 IOP for all Xen surgeries followed up to 12 months (n=83).
Note: Univariate linear regression analysis: rCitation2=0.1580, P<0.0001.
Abbreviation: IOP, intraocular pressure.
Abbreviation: IOP, intraocular pressure.
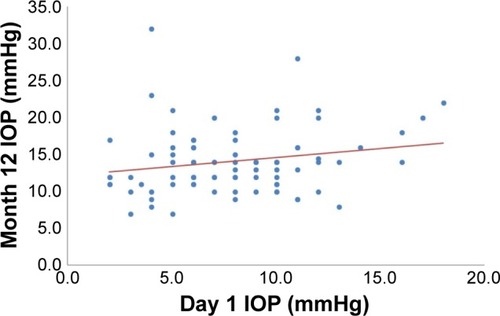
Table 2 Frequency and timepoint of postoperative complications found following Xen surgery (n=259)
Table 3 Frequency and timepoint of further procedures or treatment required following Xen surgery (n=259)