Figures & data
Table 1 Age, gender, and duration of RD in groups I and II
Table 2 OCT findings in both groups
Table 3 Specific OCT findings in each group
Figure 1 No disruption in the EZ or the ELM.
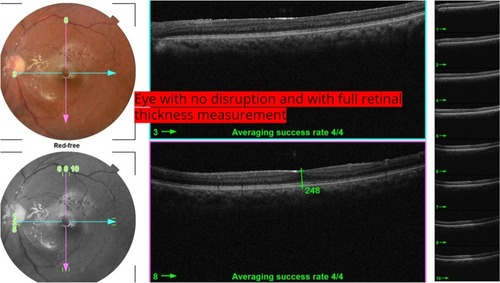
Figure 2 Disruption of EZ with normal ELM.
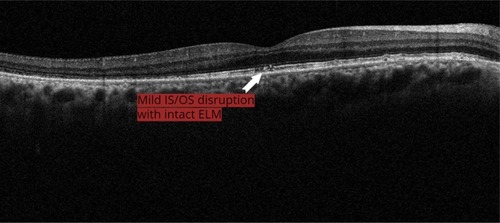
Figure 3 Combined disruption of the EZ and ELM.
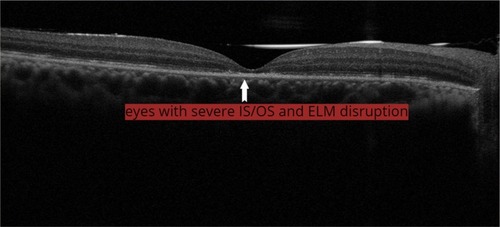
Figure 4 Early ERM ≤3 months with CME.
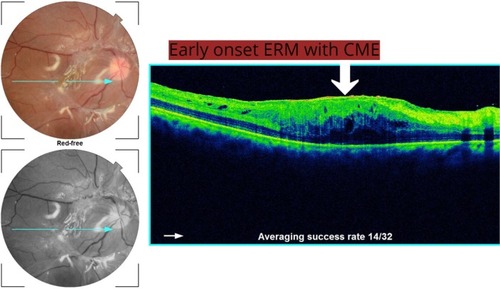
Figure 5 Late ERM >6 months with CME.
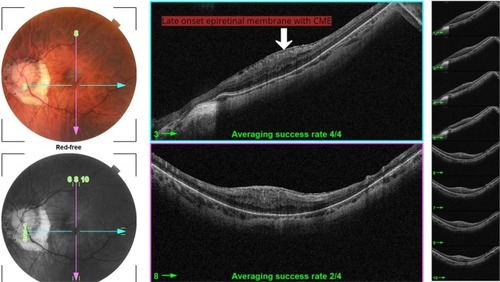
Table 4 OCT parameters of cases with no ERM and with mild-to-moderate disruption
Table 5 OCT parameters of cases with no ERM and with severe disruption
Table 6 Comparison of macular thickness and ONLT between operated eyes with no ERM from groups I and II
Figure 6 Correlation between 6-month postoperative LogMAR BCVA and severity of disruption.
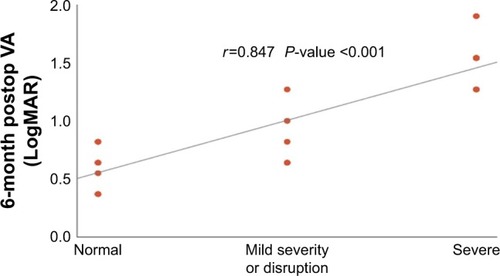
Figure 7 Correlation between 6-month postoperative LogMAR BCVA and ONLT.
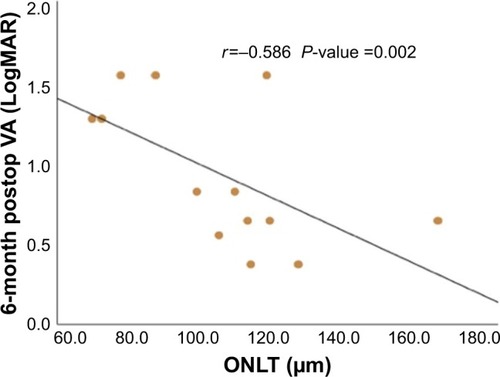
Figure 8 Correlation between 6-month postoperative LogMAR BCVA and average macular thickness.
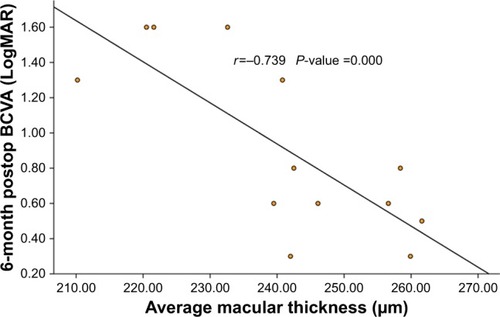
Figure 9 Correlation between 6-month postoperative LogMAR BCVA and central macular thickness.
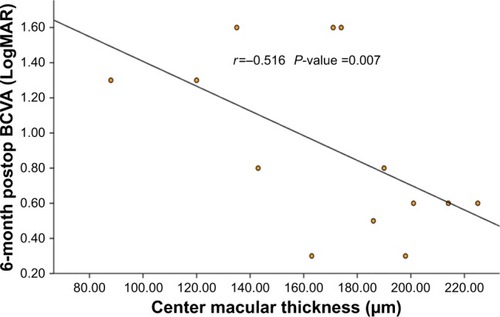
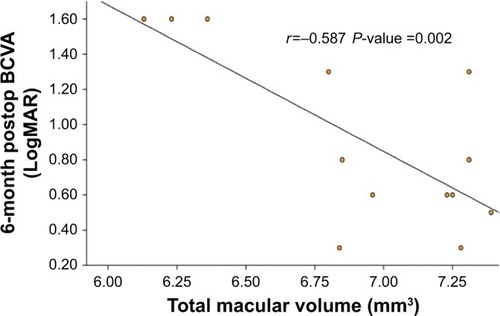
Figure 10 Correlation between 6-month postoperative LogMAR BCVA and total macular volume.