
Figures & data
Figure 1 Dry eye prevalence in US and Miami by months, 2010–2013.
Abbreviation: DE, dry eye.
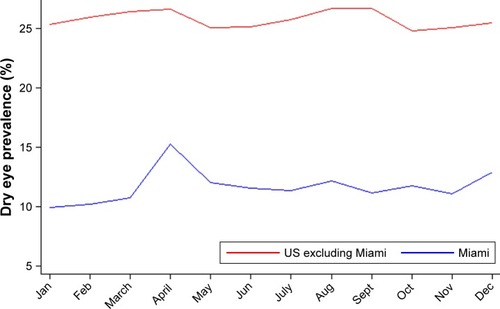
Table 1 DE symptom questionnaire scores by month from 2014 to 2016, including multiple visits
Figure 2 Monthly distribution of the selected DE symptoms and signs among Miami veterans, 2014–2016.
Abbreviations: DE, dry eye; DEQ5, Dry Eye Questionnaire 5; NPSI, Neuropathic Pain Symptom Inventory; OSDI, Ocular Surface Disease Index.
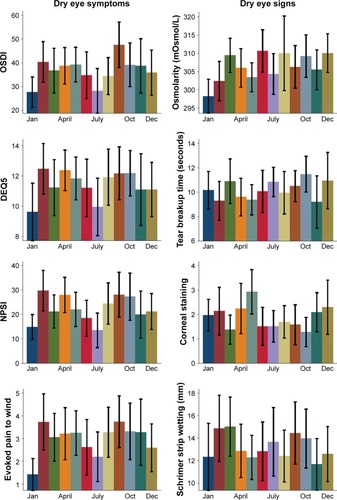
Table 2 DE tear film parameters by month from 2014 to 2016, including multiple visits
Table 3 Multivariable linear regression analysis considering the role of season on DE symptoms and signs while considering contribution of demographics and other comorbidities
Table S1 Monthly DE visit prevalence (%) in the US and Miami, 2010–2013
Table S2 Descriptive statistics of Miami VA Cohort recruited from 2014 to 2016 by season