
Figures & data
Table 1 Descriptive findings
Figure 1 Flowchart of the studies.
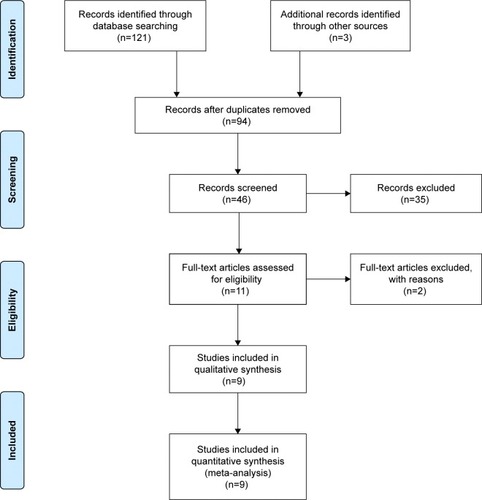
Figure 2 Forest plot of the agreement between smartphones and retinal cameras.
Abbreviations: Q, heterogeneity among studies – fixed effects; ICitation2, between-studies variability (%)-fixed effects; Qv, heterogeneity among studies – random effects; ICitation2, between-studies variability (%)-random effects; es, effect summary; CI, confidence interval; SE, standard error; CI lower, lower confidence interval; CI upper, upper confidence interval.
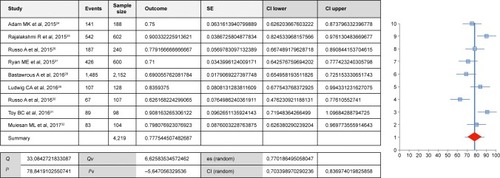
Figure 3 ROC curve.
Note: Data from five studies.Citation25–Citation27,Citation30,Citation31
Abbreviations: AUC, area under the curve; ROC, receiver operating characteristic.
Abbreviations: AUC, area under the curve; ROC, receiver operating characteristic.
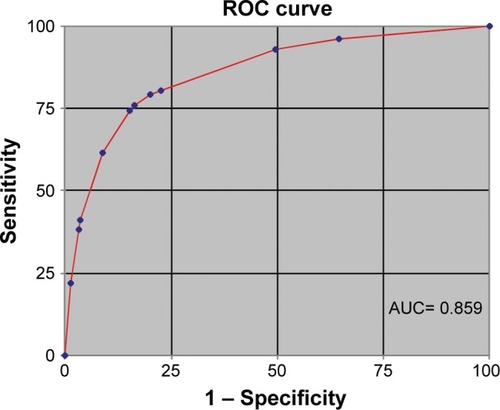
Figure 4 Assessment of risk of bias.
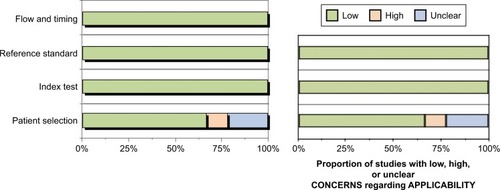
Table S1 Search strategy used on databases