Figures & data
Figure 1 Study flowchart.
Notes: Patients were imaged with both the IOLMaster 700 and the LENSTAR LS 900. The total acquisition time and biometry values for each device were recorded.
Abbreviation: K, keratometry.
Abbreviation: K, keratometry.
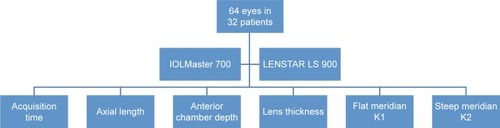
Table 1 Demographics of the study subjects
Table 2 Mean acquisition times of the IOLMaster 700 and LENSTAR LS 900
Table 3 ICCs between the mean biometry values of the IOLMaster 700 and LENSTAR LS 900
Figure 2 Linear regression of the IOLMaster 700 vs the LENSTAR LS 900.
Notes: (A) Axial length, (B) anterior chamber depth, (C) lens thickness, (D) keratometry 1, and (E) keratometry 2.
Abbreviation: K, keratometry.
Abbreviation: K, keratometry.
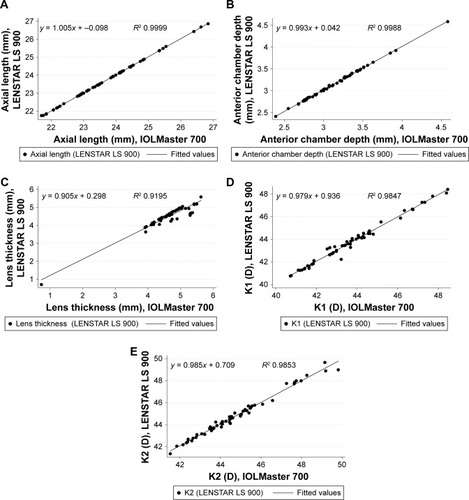
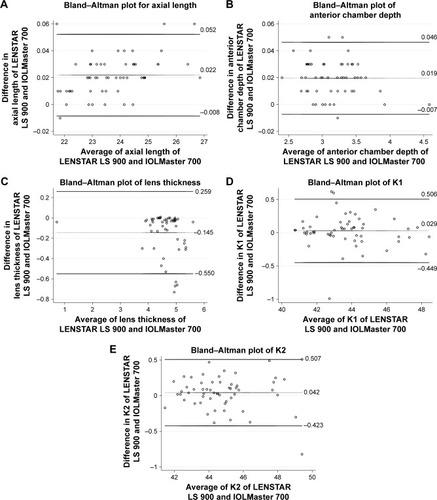
Figure 3 Bland–Altman plots showing the mean difference (dotted line) and 95% upper and lower limits of agreement (solid lines) for biometry measurements obtained by the IOLMaster 700 and LENSTAR LS 900.
Notes: (A) Axial length, (B) anterior chamber depth, (C) lens thickness, (D) keratometry 1, and (E) keratometry 2.
Abbreviation: K, keratometry.
Abbreviation: K, keratometry.