Figures & data
Table 1 Demographics of participants
Figure 1 A typical example of a circumpapillary spectral-domain optical coherence tomography scan.
Notes: (A) Retinal layer boundaries were automatically detected by the image-segmentation algorithm. cpRNFL, cpGCC, cpOR, and cpTR thickness were measured. (B) Circumpapillary retinal layer sectors used for the analysis in the current investigation are shown. Retinal thickness measurements were performed around a 3.45 mm diameter circle.
Abbreviations: cpGCC, circumpapillary ganglion cell complex; cpOR, circumpapillary outer retina; cpRNFL, circumpapillary retinal nerve fiber; cpTR, circumpapillary total retina; I, inferior; N, nasal; S, superior; T, temporal.
Abbreviations: cpGCC, circumpapillary ganglion cell complex; cpOR, circumpapillary outer retina; cpRNFL, circumpapillary retinal nerve fiber; cpTR, circumpapillary total retina; I, inferior; N, nasal; S, superior; T, temporal.
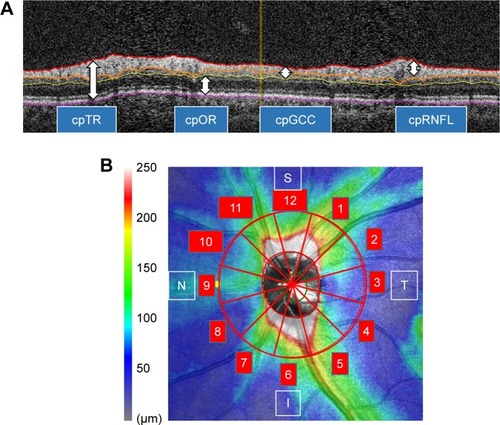
Figure 2 A typical example of a normal eye.
Notes: Color fundus photograph (A). Humphrey 30-2 Swedish interactive threshold-algorithm visual field: (B) gray scale; (C) threshold-sensitivity values. The 12 cpRNFL (D), cpGCC (E), cpOR (F), and cpTR (G) sectors. The 12 circumpapillary microperimetry-sensitivity sectors (H) of the normal right eye of a 46-year-old male subject.
Abbreviations: cpGCC, circumpapillary ganglion cell complex; cpOR, circumpapillary outer retina; cpRNFL, circumpapillary retinal nerve fiber; cpTR, circumpapillary total retina.
Abbreviations: cpGCC, circumpapillary ganglion cell complex; cpOR, circumpapillary outer retina; cpRNFL, circumpapillary retinal nerve fiber; cpTR, circumpapillary total retina.
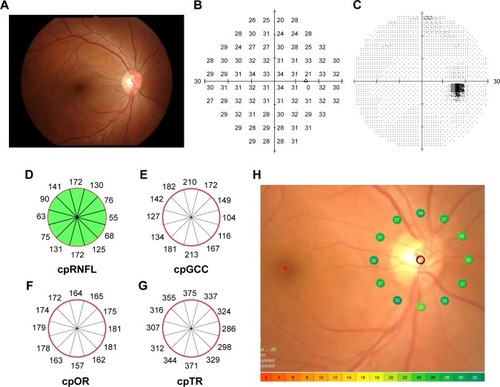
Figure 3 A typical example of a glaucoma eye.
Notes: Color fundus photograph (A). Humphrey 30-2 Swedish interactive threshold-algorithm visual field: (B) gray scale; (C) threshold-sensitivity values. The 12 cpRNFL (D), cpGCC (E), cpOR (F), and cpTR (G) sectors. The 12 circumpapillary microperimetry-sensitivity sectors (H) of the glaucomatous left eye of a 60-year-old female primary open-angle glaucoma patient. Inferotemporal structural damage (neuroretinal rim loss on A and RNFL thinning on D) corresponded spatially with the superior Bjerrum scotoma shown by the Humphrey visual field (B, C). The circumpapillary microperimetry test (H) showed significant inferotemporal sensitivity reduction around the disk.
Abbreviations: cpGCC, circumpapillary ganglion cell complex; cpOR, circumpapillary outer retina; cpRNFL, circumpapillary retinal nerve fiber; cpTR, circumpapillary total retina.
Abbreviations: cpGCC, circumpapillary ganglion cell complex; cpOR, circumpapillary outer retina; cpRNFL, circumpapillary retinal nerve fiber; cpTR, circumpapillary total retina.
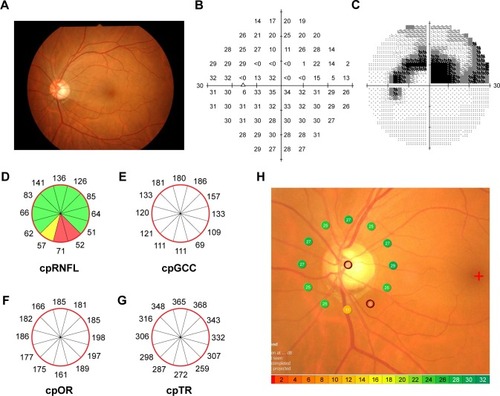
Table 2 Comparison of various circumpapillary retinal thickness sectors between groups
Table 3 Comparison of circumpapillary retinal sensitivity between groups
Table 4 Correlation between circumpapillary retinal thickness parameters and the corresponding retinal sensitivity thresholds in total population (n=36)
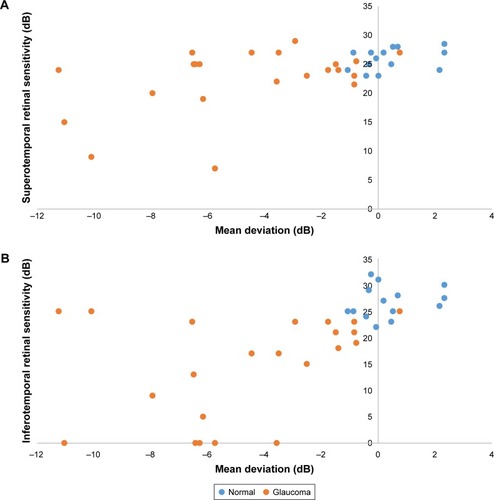
Figure 4 Scatterplots of associations between visual field mean deviation and superotemporal and inferotemporal circumpapillary retinal sensitivity.
Notes: (A) Relationship between circumpapillary retinal sensitivity determined for sector 1 (superotemporal sector) and mean deviation. (B) Relationship between circumpapillary retinal sensitivity determined for sector 5 (inferotemporal sector) and mean deviation. Significant correlations were found for both sectors (sector 1, r=0.470; P=0.04; sector 5; r=0.685, P<0.001).