Figures & data
Figure 1 Examples of standardized eye charts.
Notes: (A) Snellen test for acuity.Citation3 Reproduced from Dahl J. A typical Snellen chart. Available from: https://commons.wikimedia.org/wiki/File:Snellen_chart.svg. Creative Commons license and disclaimer available from: http://creativecommons.org/licenses/by/4.0/legalcode.Citation38 (B) LogMAR test for acuity.Citation4 Reprinted from Vision Res, 90, Bailey IL, Lovie-Kitchin JE, Visual acuity testing. From the laboratory to the clinic. 2–9, Copyright (2013), with permission from Elsevier.Citation37
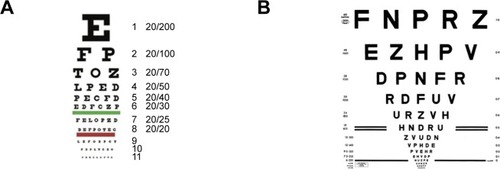
Figure 2 Illustration of a typical block letter E where each of five vertical segments subtends 1 minute of arc (totaling 5).
Note: Note that the angles are not drawn to scale.
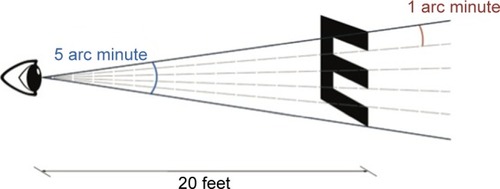
Figure 3 Distribution of VPI scores among a population, modeled as a normal distribution with a mean of 100 and an SD of 15.
Note: Shaded areas show regions with an equal area of 20%: scores less than 87 (bottom 20%) are considered as abnormally low, while scores greater than 113 (top 20%) are considered as abnormally high.
Abbreviation: VPI, vision performance index.
Abbreviation: VPI, vision performance index.
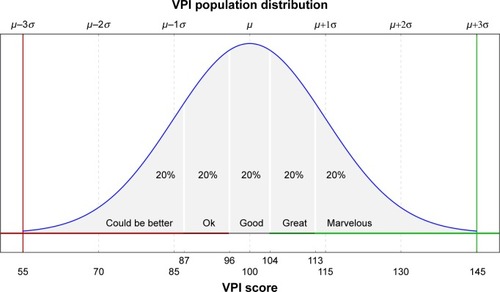
Figure 4 The five components of the VPI: FAMED and their subcomponents.
Note: Each individual component is scored, providing additional detail on top of the main, or overall, VPI score.
Abbreviations: VPI, vision performance index; FAMED, field of view, accuracy, multi-tracking, endurance and detection.
Abbreviations: VPI, vision performance index; FAMED, field of view, accuracy, multi-tracking, endurance and detection.
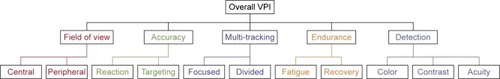
Table 1 Number of users from the baseline study matching each category in a number of demographic groups
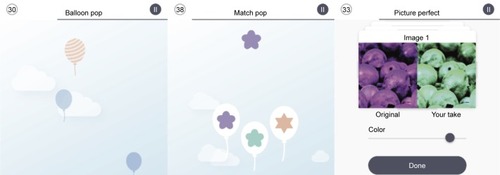
Figure 5 Example experiences used to gather baseline sample data.
Notes: Left: Users must click or tap target balloons (those with stripes) and ignore distractor balloons (those without stripes); balloons vary randomly in size, color, transparency and speed (moving up). Middle: Users must click or tap target balloon containing the matching color and shape combination given at the top; one target is presented with varying number of distractors with random size, color and shape. Right: Users must use the slider to adjust the right image to match the left image; the parameter adjusted by the slider varies by trial among color (hue), saturation, brightness, (luminance) contrast, (Gaussian) blur and size. Each experience lasts 45 seconds, with a countdown timer (upper left corner) and rightward moving progress bar (grey line below experience title). Users may pause using the pause button (upper right corner).