
Figures & data
Figure 1 Exophthalmos measurement.
Note: Exophthalmos value was defined as the perpendicular distance from the top point of the corneal surface to the line between the bilateral frontal processes of the zygomatic bones.
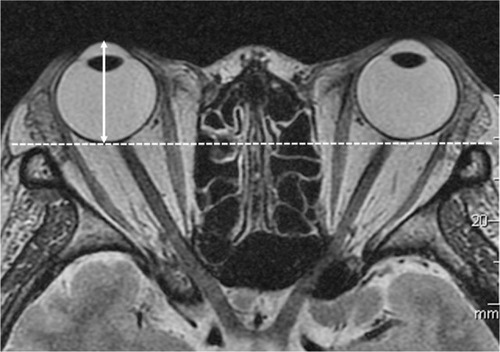
Figure 2 Volume measurement.
Notes: Regions of interest (ROIs) were drawn around tissue on MR images, and cross-sectional areas of the ROIs were measured. The volume of each tissue type was calculated by multiplying the sum of the cross-sectional area by the slice thickness (1.5 mm). (A) Axial slice shows cross-sectional areas of orbital fat (Fat). (B) Axial slice shows the cross-sectional areas of the lateral rectus (LR) and medial rectus (MR) muscles, eyeball (EB), and optic nerve (ON). (C) Sagittal slice shows the cross-sectional areas of the superior rectus (SR) and inferior rectus (IR) muscles. (D) Axial slice shows the cross-sectional area of the superior oblique (SO) muscle. (E) Coronal slice shows the cross-sectional areas of the inferior oblique (IO) muscle.
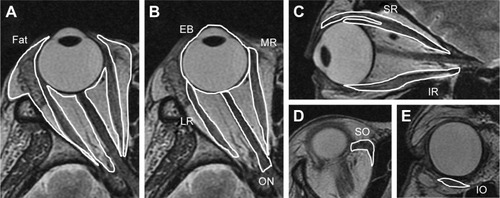
Table 1 Characteristics of patients with TAO
Figure 3 Diagram of patients who were included and dropped out.
Notes: Thirteen patients were included in this study. Four of the 13 dropped out. In the final analysis, we analyzed nine orbits of nine patients.
Abbreviation: TAO, thyroid-associated ophthalmopathy.
Abbreviation: TAO, thyroid-associated ophthalmopathy.
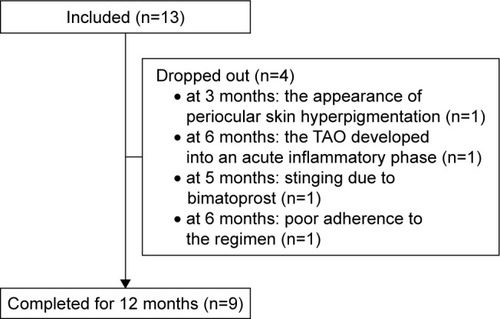
Table 2 Changes in exophthalmos values and orbital tissue volume from before to after treatment with bimatoprost
Figure 4 Exophthalmos values.
Note: Mean values after 12 months of treatment were not significantly different from those before treatment (P=0.82).
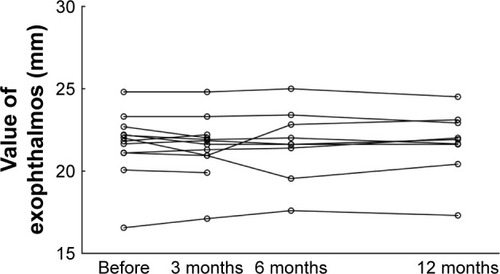
Figure 5 Orbital fat volume.
Note: Mean volume after 12 months of treatment was not significantly different from that before treatment (P=0.70).
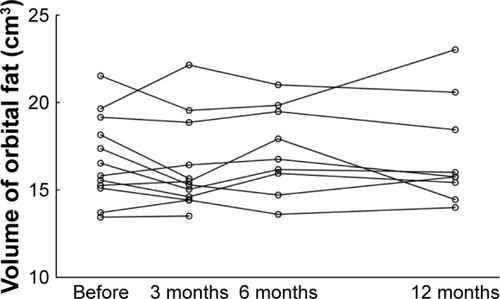
Figure 6 Extraocular muscle volume.
Note: Mean volume after 12 months of treatment was not significantly different from that before treatment (P=0.32).
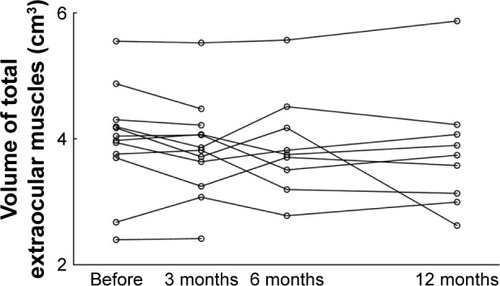
Table 3 Exophthalmos values and orbital tissue volume from before treatment to last MRI examination in patients who dropped out