Figures & data
Figure 1 Trigonometry relation between display and bowl perimeter, 52 points 24° to be tested.
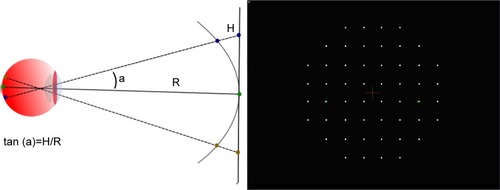
Figure 2 Monitor or virtual reality glasses can be used for visual field testing.
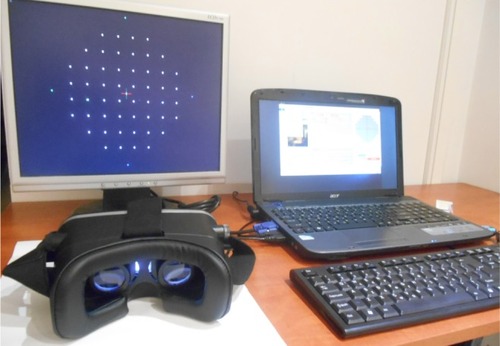
Figure 3 Display – gamma calibration using a gray scale step-wedge.
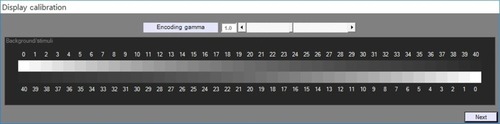
Figure 4 Patient testing in front of a monitor.
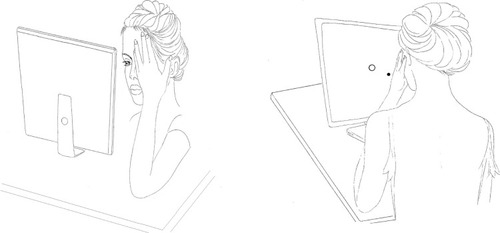
Figure 5 Examination form of the software, eye tracking.
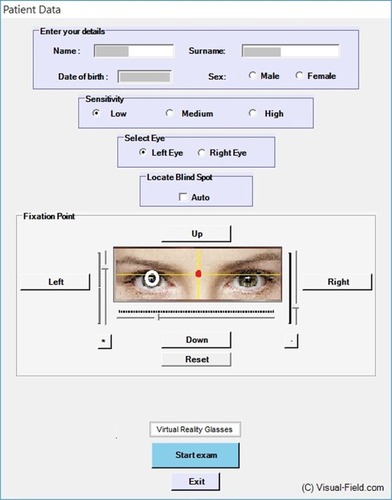
Figure 6 Exam sent by email.
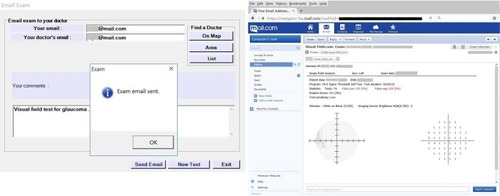
Figure 7 Eye 1 of 20. Humphrey field analyser test compared with three screening tests at high, medium, and low sensitivity levels (brightest stimulus, −12 dB).
Note: As the stimulus gets brighter, the number of positive responses increases.
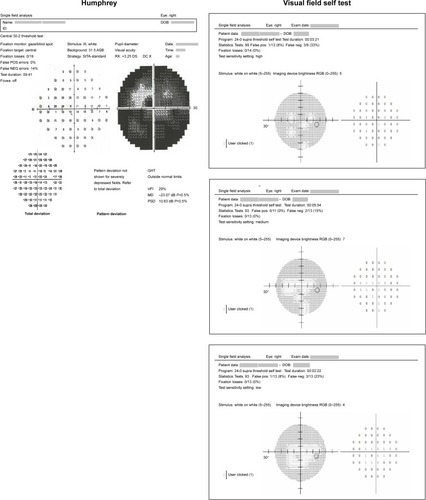
Table 1 Threshold data at high, medium, and low sensitivity
Table 2 Reliability indices
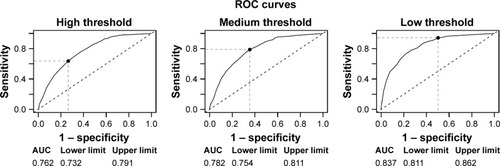
Figure 8 ROC curves for each threshold.
Abbreviations: AUC, area under the curve; ROC, receiver operating characteristic.