
Figures & data
Table 1 Patient demographics
Table 2 Central corneal epithelial and stromal thickness
Figure 1 Epithelial and stromal thickness within 2–5 mm zone (5 mm) and the 5–6 mm zone (6 mm) measured across all eight regions. (A) In both the 5 mm and 6 mm corneal zones, the corneal epithelium was thickest inferiorly and inferior nasally and thinnest superiorly (*P<0.001 for N compared to ST, S, and T; **P<0.05 for IN compared to ST, S, T, SN, IT, and N; ***P<0.05 for I compared to ST, S, T, SN, IT, N, and IN; ****P>0.05 for IT compared to ST, S, and T; *****P<0.05 for SN compared to ST, S, and T; One-way ANOVA, Student-Newman-Keuls post hoc multiple comparison test). Epithelial thickness values at all regions were significantly different between the 5 mm and 6 mm zones (P=0.009). (B) Unlike the corneal epithelium, corneal stromal thickness was thickest superiorly and thinnest in the inferior temporal region (*P<0.001 for S compared to all other regions except SN; **P<0.001 for SN compared to all other regions; ***P<0.001 for N compared to IT, T, and I; ****P<0.001 for ST compared to IT, T, and I; *****P<0.05 for IN compared to IT, T, and I; and ******P<0.05 for I compared to IT and T; One-way ANOVA, Student-Newman-Keuls post hoc multiple comparison test). Overall stromal thickness was uniformly thinner within the 5 mm zone compared to the 6 mm zone (P<0.001). Data presented as mean±standard error.
Abbreviations: I, inferior; IN, inferior nasal; IT, inferior temporal; N, nasal; S, superior; SN, superior nasal; ST, superior temporal; T, temporal.
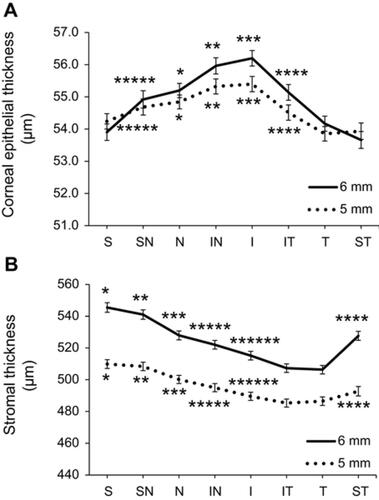
Figure 2 Corneal epithelial and stromal thickness in males vs females. (A) Epithelial thickness within the 5 mm zone was significantly thicker in the inferior and inferior nasal region (*P<0.05 for IN compared to ST, T, and S; **P<0.05 for I compared to ST, T, and S; Two-way ANOVA, Student-Newman-Keuls post hoc multiple comparison test). Across all regions, the epithelium was thicker for males compared to females (P<0.001). (B) Stromal thickness within the 5 mm zone was thickest superiorly (*P<0.05 for S compared to IT, T, I, IN, and ST; **P<0.05 for SN compared to IT, T, I, and IN; ***P<0.05 for N compared to IT, T, and I; ****P<0.05 for ST compared to IT and T; Two-way ANOVA, Student-Newman-Keuls post hoc multiple comparison test). Stromal thickness was greater in males than females in all regions (P<0.001). (C) In the 6 mm zone, the epithelium was also thickest in the inferior and inferior nasal region (*P<0.05 for IN compared to ST, T, and S; **P<0.05 for I compared to ST, T, and S; Two-way ANOVA, Student-Newman-Keuls post hoc multiple comparison test). Similar to the 5 mm zone, the epithelium was thicker for males than females across all regions (P<0.001). (D) Stromal thickness within the 6 mm zone was also thicker superiorly, with a greater difference between the superior and inferior stroma (*P<0.001 for S compared to all other regions except SN; **P<0.05 for SN compared to all other regions; ***P<0.05 for N compared to all other regions except T, IT, and I; ****P<0.05 for ST compared to T, IT, and I; *****P<0.05 for IN compared to T and IT; Two-way ANOVA, Student-Newman-Keuls post hoc multiple comparison test). Again, males had a greater stromal thickness than females across all regions (P<0.001). Data presented as mean±standard error.
Abbreviations: I, inferior; IN, inferior nasal; IT, inferior temporal; N, nasal; S, superior; SN, superior nasal; ST, superior temporal; T, temporal.
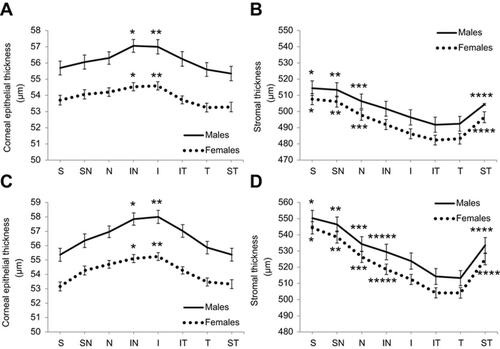
Figure 3 Distribution of central corneal thickness across all subjects. Data is plotted as the normalized number of males and females per total number in each group.
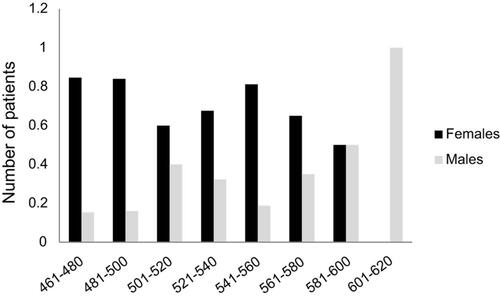
Table 3 Corneal epithelial and layer offset values for thin vs non-thin corneas
Table S1 Comparison of OD vs OS for all geographic regions within the 5 mm zone
Table S2 Comparison of OD vs OS for all geographic regions within the 6 mm zone