
Figures & data
Table 1 Subject accountability at 36 months postoperative
Table 2 Demographics and preoperative ocular characteristics, Consistent Cohort (n=87)
Table 3 Proportions of eyes with decreased, maintained, or increased medication burden versus preoperative, Controlled Group (n=49)
Figure 1 iStent® Trabecular Micro-Bypass.
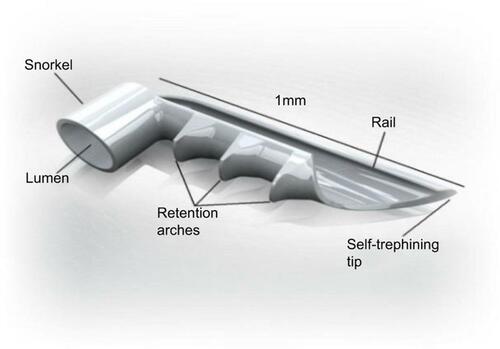
Figure 2 iStent® implantation location.
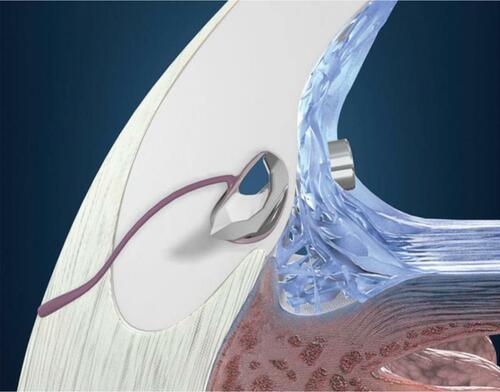
Table 4 Proportions of eyes with decreased, maintained, or increased medication burden versus preoperative, Uncontrolled Group (n=38)
Figure 3 Mean medication burden and IOP through 36 months postoperative, Controlled Group (goal to reduce medications), Consistent Cohort (n=49).
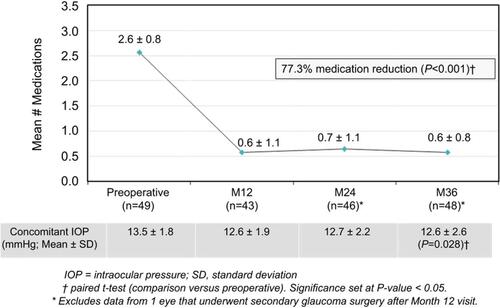
Figure 4 Proportional analysis of medication burden through 36 months postoperative, Controlled Group, Consistent Cohort (n=49).
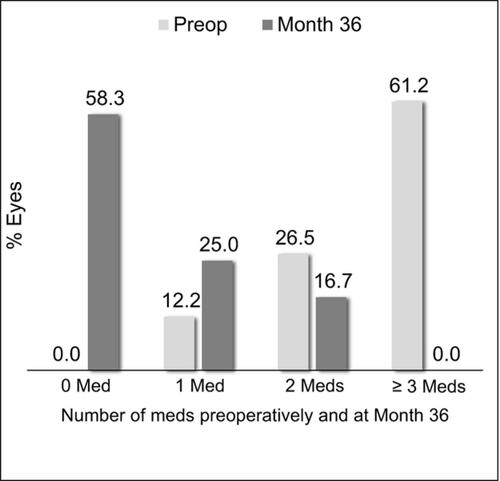
Figure 5 Mean IOP and medication burden through 36 months postoperative, Uncontrolled Group (goal to reduce IOP), Consistent Cohort (n=38).
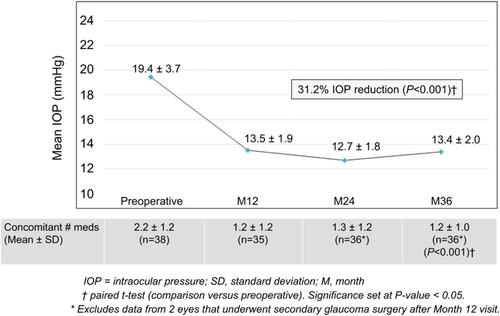
Figure 6 Proportional analysis of medication burden, Uncontrolled Group, Consistent Cohort (n=38).
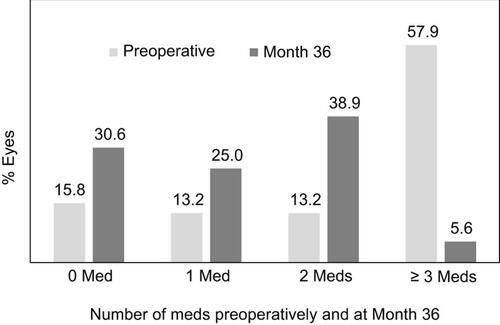
Table 5 Visual field mean deviation (MD) through 36 months postoperative, Eyes with available data at each visit
Table 6 Mean peripapillary RNFL thickness through 36 months postoperative, Eyes with available data at each visit