Figures & data
Figure 1 Study visit schedule. Diagram represents the overall study timeline, delineating the temporal relationship between screening visits, Controlled Adverse Environment (CAE) and drug dosing sessions, and the recovery period.
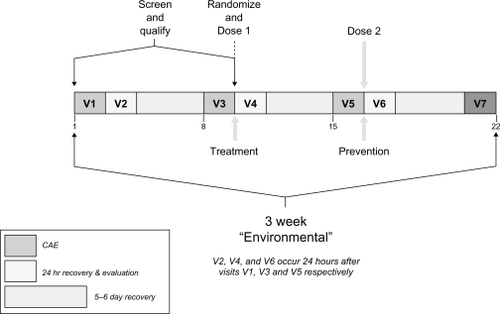
Table 1 Procedures and assessments summary
Figure 2 Ocular iontophoresis application. The photo shows the iontophoretic applicator placement on the eye.
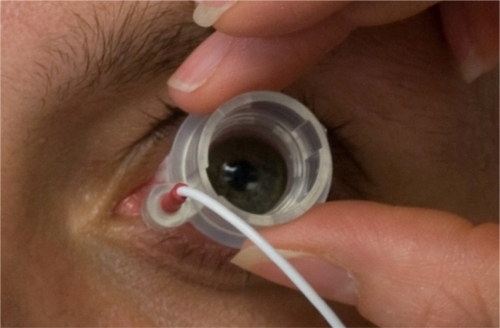
Figure 3 Patient disposition. The flow chart depicts the distribution of patients throughout the study as well as inclusion/exclusion numbers, study populations, and treatment arms.
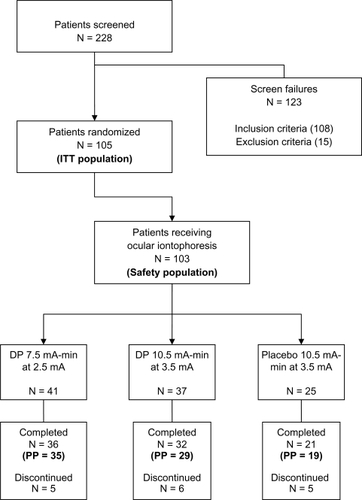
Table 2 Secondary endpoints: statistically significant results compared with placebo shown in bold (p <0.05).
Figure 4 Corneal staining is decreased by iontophoretic dexamethasone phosphate. The mean change in corneal fluorescein staining (inferior region) between visit 1 (baseline) to visit 7 for each treatment group. Over this time frame, the DP 7.5 treatment group showed a statistically significant decrease in staining compared with the placebo treatment group.
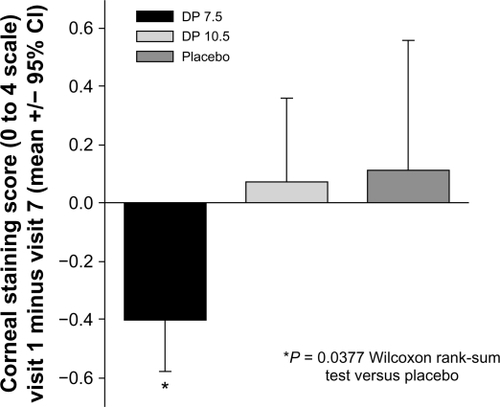
Figure 5 Mean ocular discomfort scores during CAE exposure at visit 5. The plot depicts the mean discomfort scores for the placebo and DP 7.5 treatment groups during the course of the visit 5 CAE session. The DP 10.5 group, which was not significantly different from placebo, is omitted for clarity. Data included in the mean value calculation were from the PP-WE population of each group. The DP 7.5 group mean values are significantly lower (P < 0.05) than placebo for all times >60 minutes. Error bars represent standard error of the mean.
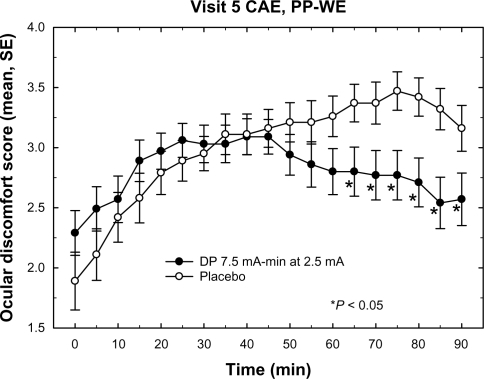
Table 3 TFBUT in ocular discomfort subgroups. Values in bold are statistically significant (p < 0.05)
Table 4 Subject-reported ocular TEAEs. The totals for each group, along with the number of subjects with multiple AEs, are in bold for emphasis.