Figures & data
Table 1 Demographic and clinical data for patients with non-neovascular pigment epithelial detachment
Figure 1 Photo, fundus color photos before half-dose photodynamic therapy (PDT) procedure. ICGA, indocyanine angiography; OCT, optical coherence tomography; 1M, 3M, 1Y and 2Y, OCT 1, 3 months, 1 year, and 2 years after half-dose PDT procedure. The defect images of fundus and OCT (the number 1 patient of OCT 2 years after the procedure) were confirmed with ophthalmoscope by the retinal specialists.
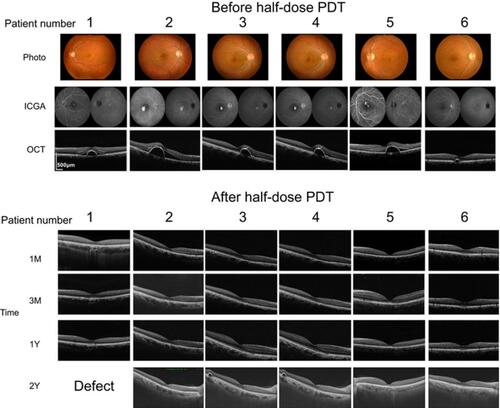
Figure 2 Photo, fundus color photos before half-dose photodynamic therapy (PDT) procedure. ICGA, indocyanine angiography; OCT, optical coherence tomography; 1M, 3M, 1Y, and 2Y, OCT 1, 3 months, 1 year, and 2 years after half-dose PDT procedure. The defect images of fundus and OCT (the number 7 patient of OCT 1 year and 2 years after the procedure) were confirmed with ophthalmoscope by the retinal specialists.
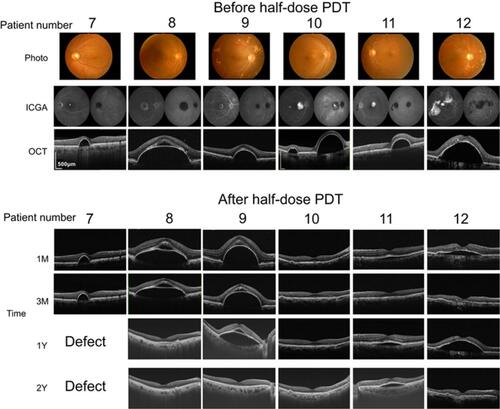
Table 2 Patients’ ocular characteristics
Table 3 Receiver operating characteristic data
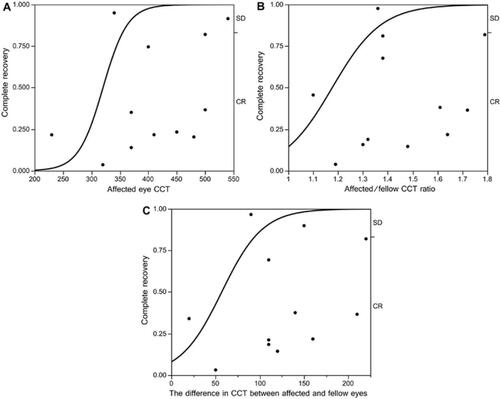
Figure 3 Comparison of AUC between different models. (A) AUC for CCT in the affected eye is 0.84 (P=0.05, Chi-square test). Best positive likelihood ratio was 0.75 at 360 µm (Fisher’s exact test). (B) AUC for the affected-fellow CCT ratio was 0.91 (P=0.006, Chi-square test). Best positive likelihood ratio was 0.75 (Fisher’s exact test) at 1.37 (P-values at 1.30 and 1.40 at 0.08 and 0.07, respectively, Fisher’s exact test). (C) AUC for the difference in CCT was 0.95 (P=0.001, Chi-square test). Best positive likelihood ratio was 0.75 at 107 and 112 µm (P-values at 100 and 110 µm were 0.02 and 0.06, respectively, Fisher’s exact test).
Abbreviations: AUC, area under the receiver operating characteristic curve; CCT, central choroidal thickness; SD, stable disease; CR, complete response.