Figures & data
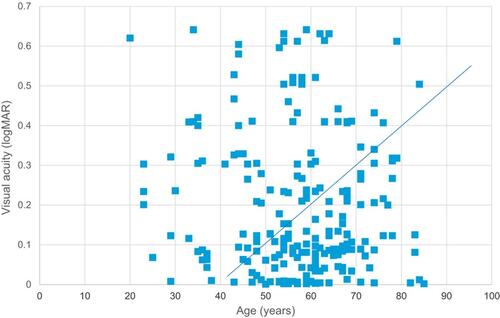
Figure 1 Morphological calcification of optical coherence tomography (OCT) patterns in diabetic macular edema demonstrating (A) sponge-like diffuse retinal thickness (SLDRT), (B) cystoid macular edema (CME), and (C) subretinal fluid (SRF).
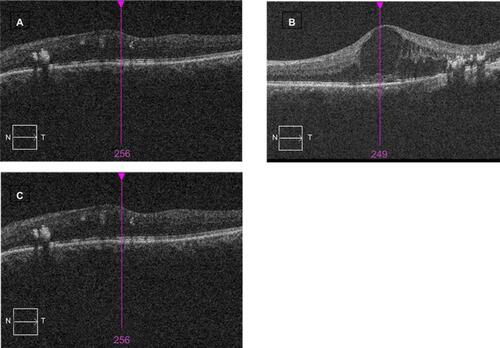
Table 1 Summary of the frequency of OCT based DME morphological patterns
Table 2 Mean visual acuity and retinal thickness within subtypes of DME
Table 3 Correlations between morphologic subtypes with visual acuity
Table 4 Correlations between diabetic stage and macular thickness
Table 5 Correlations between diabetic retinopathy stage and subtypes of DME
Figure 2 Graph showing relationship between central macular thickness (CMT) and visual acuity.
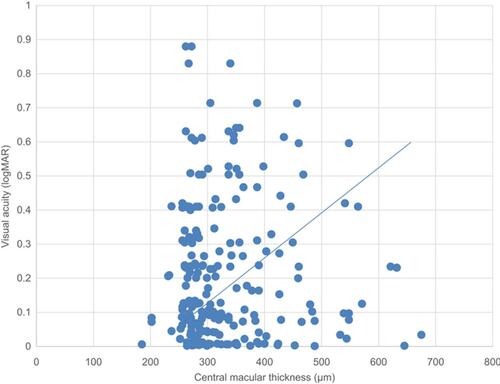
Table 6 Significant correlations of diabetic type, age, and duration with visual acuity
Figure 3 Graph showing relationship between duration and visual acuity (LogMAR).
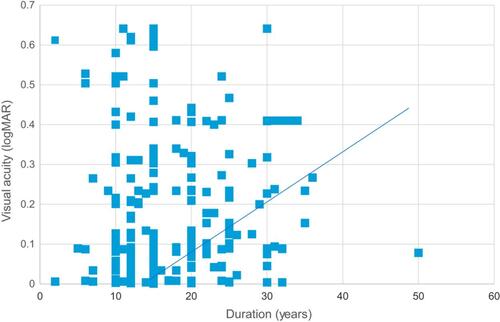
Figure 4 Graph showing relationship between age and visual acuity (LogMAR).