Figures & data
Table 1 Body weights and serum glucose levels of control and streptozotocin (STZ)-induced diabetic rats
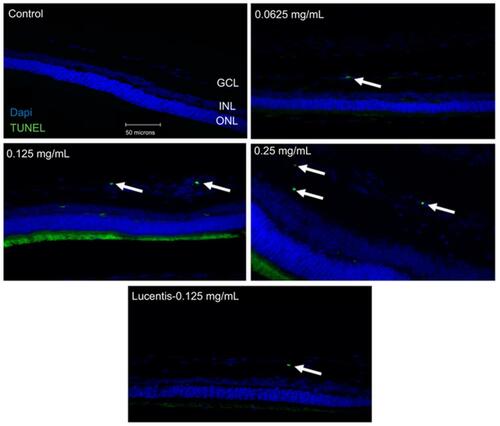
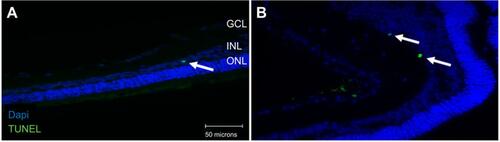
Figure 1 Terminal deoxynucleotidyl transferase dUTP nick end labeling (TUNEL) staining of diabetic rat retina. TUNEL staining performed in streptozotocin (STZ)-induced diabetic rats showed increased apoptotic cells in the ganglion cell layer following different doses of anti-VEGF injections compared with untreated retina from the diabetic control group. Blue represents 4′,6-diamidino-2-phenylindole (DAPI)-stained nuclei and green represents TUNEL staining. Magnification x40. n=5 for each group. Scale bar: 50 µm.
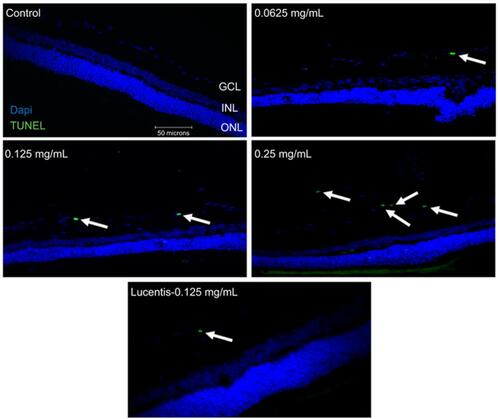
Figure 2 Apoptotic cell death rates following different doses and frequency of rat anti-VEGF and ranibizumab in non-diabetic and diabetic rats. The number of Terminal deoxynucleotidyl transferase dUTP nick end labeling (TUNEL)-positive cells in the ganglion cell layer (GCL) was significantly greater at double the clinical dose (0.25 mg/mL) in the non-diabetic rats (A) and significantly greater at half the clinical (0.0625 mg/mL), clinical (0.125 mg/mL), and double the clinical dose (0.25 mg/mL) in the diabetic rats (B) compared to untreated controls. Comparing the clinical dose of ranibizumab (Lucentis-0.125 mg/mL) to the clinical dose of rat anti-VEGF (0.125 mg/mL) in non-diabetic (A) and diabetic (B) rats, neither was significantly different regarding the number of TUNEL-positive cells. In the diabetic rats (B), both the clinical dose of ranibizumab and rat anti-VEGF had significantly increased numbers of TUNEL-positive cells compared to untreated diabetic control. Injecting the clinical dose of rat-anti-VEGF once versus three times over the span of 3 weeks showed no significant difference between each other for both the non-diabetic (A) and diabetic (B) rats. In the diabetic rats (B), injecting once or 3 times both showed significantly increased TUNEL-positive cells compared to untreated diabetic controls. Data are expressed as means±SD. n=5 for each group. *p<0.03, ***p=0.0004 compared to controls.
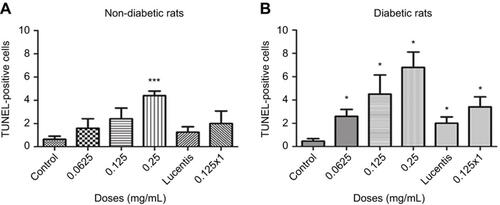
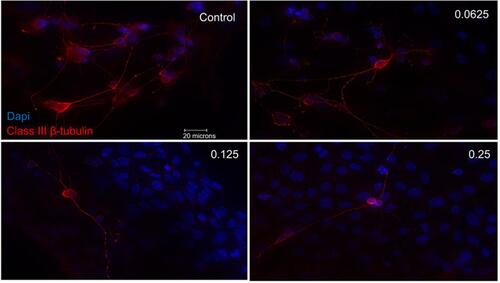
Figure 3 Morphological effect of different concentrations of ranibizumab on retinal ganglion cells (RGCs) following 72 hrs post-treatment. RGCs were stained for nuclei (blue) and Class III β-tubulin (red). Immunofluorescence of RGCs under different concentrations of ranibizumab for 72 hrs showed that as the concentration increased, the morphology of the RGCs continued to change. As the concentration went from untreated control to double the clinical dose (0.25 mg/mL), the amount of RGCs showed a further decrease in number, had fewer contacts between each other and had fewer dendritic outgrowths. Magnification x60. Scale bar: 20 µm.
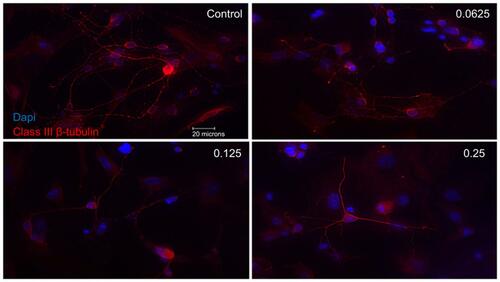
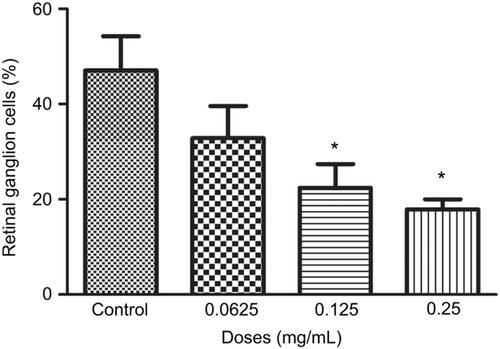
Figure 4 Percentage of retinal ganglion cells (RGCs) under different concentrations of ranibizumab. The percentage of RGCs significantly decreased at the clinical dose (0.125 mg/mL) and double the clinical dose (0.25 mg/mL) of ranibizumab at 72 hrs. Data are expressed as means±SD. n=3. *p<0.04 compared to control.
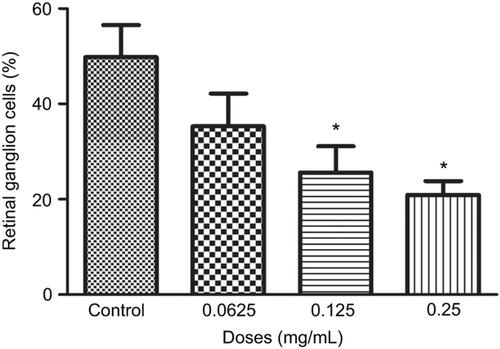
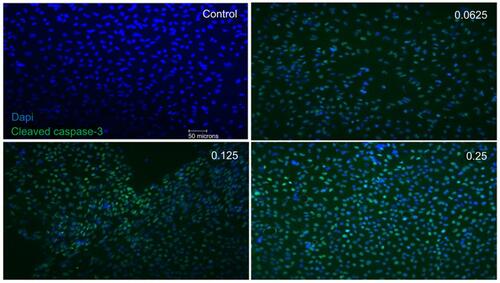
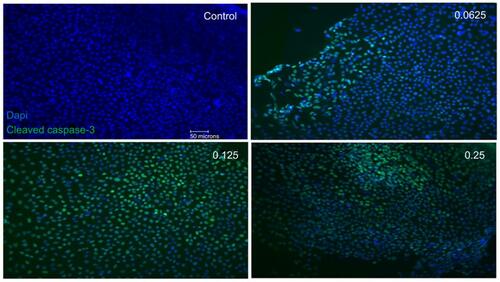
Figure 5 Apoptotic cell death of support cells surrounding retinal ganglion cells (RGCs). Performing double-labeling studies of class III β-Tubulin (red) and cleaved caspase-3 (green) indicated that RGCs began to die from apoptosis at double the clinical dose (0.25 mg/mL) (arrowhead). At all doses, it was the surrounding supporting cells around the RGCs that were dying off through apoptosis. Images are shown with 4′,6-diamidino-2-phenylindole (DAPI) staining the nuclei in blue. Magnification x60. Scale bar: 20 µm.
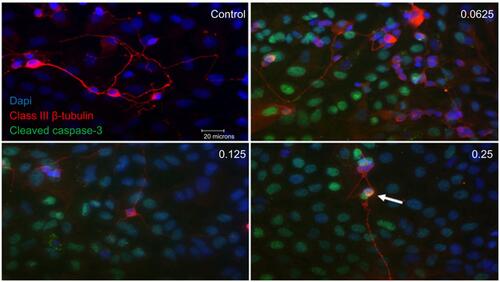
Figure 6 Cellular metabolic activity following different concentrations of ranibizumab. Cellular metabolic activity, as measured using the thiazolyl blue tetrazolium bromide (MTT) assay, was significantly decreased at the clinical dose (0.125 mg/mL) and double the clinical dose (0.25 mg/mL) of ranibizumab for both 48 (A) and 72 (B) hrs. The cellular metabolic activity was further decreased at 72 hrs. Data are expressed as means±SD. n=4. *p<0.04, **p<0.003, ***p<0.0001 compared to controls.
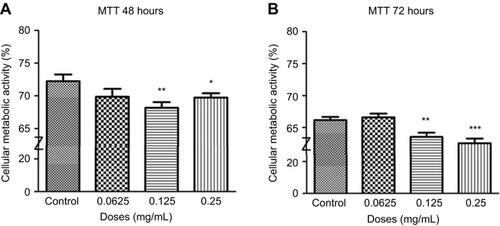
Figure 7 Necrosis following different concentrations of ranibizumab. Necrosis, as measured using the lactate dehydrogenase (LDH) assay, was significantly increased at the clinical dose (0.125 mg/mL) and double the clinical dose (0.25 mg/mL) of ranibizumab for both 48 (A) and 72 (B) hrs. There was less necrosis activity present at 72 hrs compared to 48 hrs. Data is expressed as means±SD. n=4. *p<0.04, **p<0.005 compared to controls.
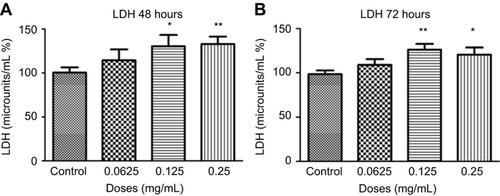
Figure 8 Apoptosis following treatments with different concentrations of ranibizumab. Apoptosis, as measured using the cell death detection enzyme-linked immunosorbent assay (ELISA) assay, was significantly increased at half the clinical (0.0625 mg/mL), clinical (0.125 mg/mL), and double the clinical dose (0.25 mg/mL) of ranibizumab for both 48 (A) and 72 (B) hrs. There was increased apoptosis present at 72 hrs compared to 48 hrs. Data are expressed as means±SD. n=4. *p<0.04, **p<0.005 compared to controls.
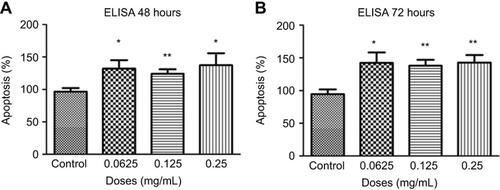
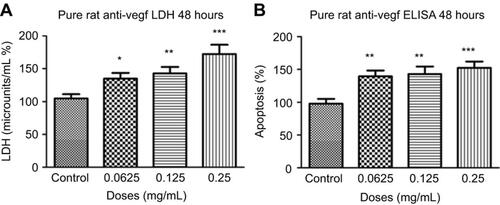
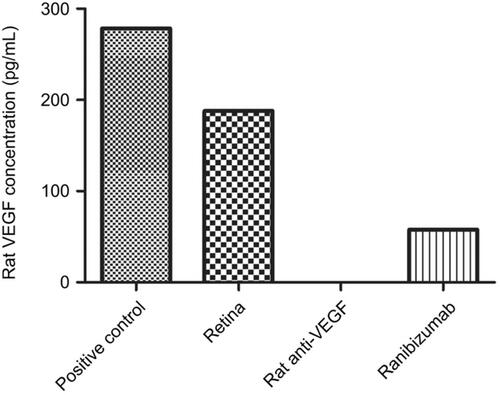
Figure 9 Necrosis and apoptosis following treatments with different concentrations of rat anti-VEGF. Necrosis (A) and apoptosis (B) at 48 hrs were significantly increased at half the clinical (0.0625 mg/mL), clinical (0.125 mg/mL), and double the clinical dose (0.25 mg/mL) of rat anti-VEGF measured using the lactate dehydrogenase (LDH) assay and cell death detection enzyme-linked immunosorbent assay (ELISA) assay. Data are expressed as means±SD. n=4. *p<0.01, **p<0.003, ***p<0.0002 compared to controls.