Figures & data
Table 1 Demographics and clinical characteristics of patients at baseline
Figure 1 Study design and patient flow through the study.
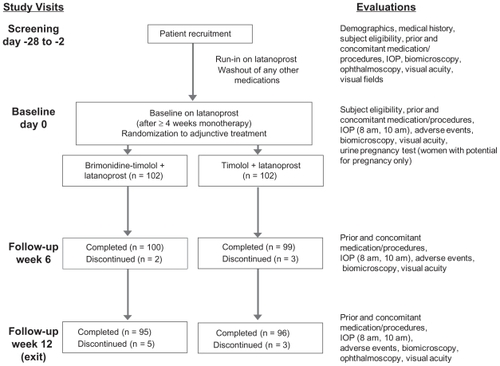
Figure 2 Mean change from latanoprost-treated baseline intraocular pressure at each time point after addition of fixed-combination brimonidine or timolol. Error bars, standard error of the mean.
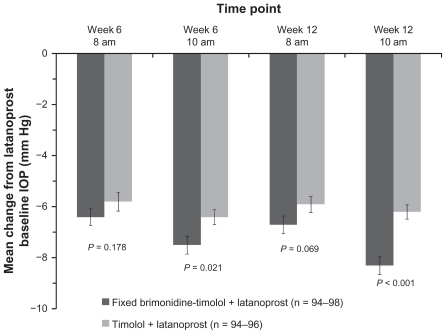
Table 2 Mean IOP at each time point and visit
Figure 3 Percentage of patients achieving specified intraocular pressure levels at both the 8 am and 10 am measurements at week 12.
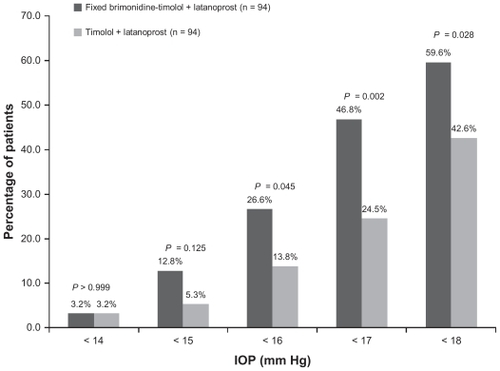
Table 3 Percentage of patients with at least a 20%, 25%, 30%, or 35% reduction in IOP from latanoprost baseline at both the 8 am and 10 am time points at week 12
Table 4 Summary of adverse events
Table 5 Treatment-related adverse events
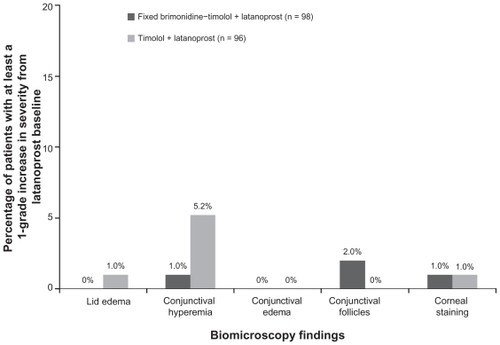
Figure 4 Percentage of patients with at least a one grade increase from latanoprost-treated baseline in severity scores on biomicroscopy at week 12.