Figures & data
Figure 1 Procedure for obtaining nCPMs. Using fast stroboscopic lighting and a CCD camera, eight images were obtained per series in 122.5 ms, at 17.5 ms intervals (exposure time, 700 μs). Usually, several series were acquired for each retinal region of interest. Top row shows 1–2 … n of subsequent series of raw images acquired under green illumination (548 nm with a band-pass of 8.5 nm), a strongly absorbing range for red blood cells. Images were corrected for illumination differences (normalized to the same average, and with low spatial frequencies removed) and aligned to one image to compensate for small eye movements, reaching a subpixel alignment resolution by interpolation. The second row shows differential (ratio) images created per image series to eliminate retina pattern. Image dust artifacts were detected and masked. These differential images were used to create one nCPM image for each series in an overlapping set of series, as shown in the third row. The small black spots are the masked dust artifacts that were emphasized here by black masks rather than gray. These were further combined into a single capillary-perfusion map.
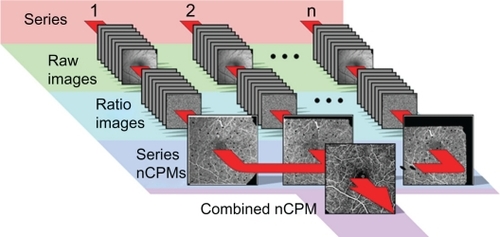
Figure 2 nCPMs provide detailed images of capillaries. (A) Red free image. (B) FA image from mid-phase obtained by fundus camera. (C) This nCPM was created by combining five series of aligned differential images (details in Materials and methods). Acquisition of this image took under 3 minutes. Borders of the foveal avascular zones are clearly delineated. Note that FA images from an earlier phase can show capillaries in greater detail than that shown here and in all other images. The ability to see details depends on acquisition timing, focus, and optical quality of a given eye. (D) Optic nerve head nCPM image from a 24-year-old healthy female. Specular reflections are strongly dependent on the angle of illumination. Especially in young subjects, this may produce “nerve fiber artifacts” due to small eye motions and an imperfect alignment. Such artifacts appear in this image but not in A.
Abbreviations: FA, fluorescein angiography; nCPM, noninvasive capillary-perfusion map.
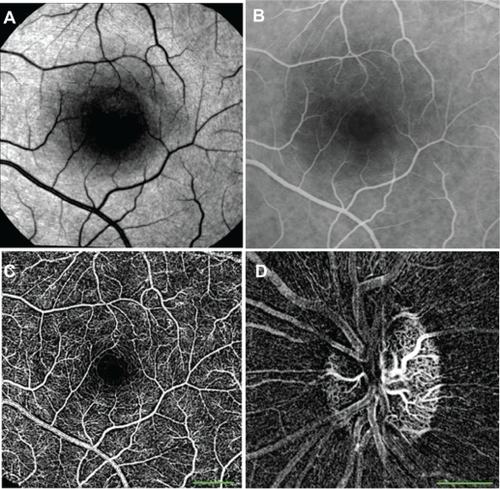
Figure 3 Variability in size of the FAZ in healthy patients. In these nCPM images from 2 of the 37 eyes of healthy subjects, FAZ area and diameter, respectively, are: 0.156 mm2, 545 μm in a 33-year-old male (A); and 0.078 mm2, 394 μm in a 30-year-old male (B).
Abbreviations: FAZ, foveal avascular zone; nCPM, noninvasive capillary-perfusion map.
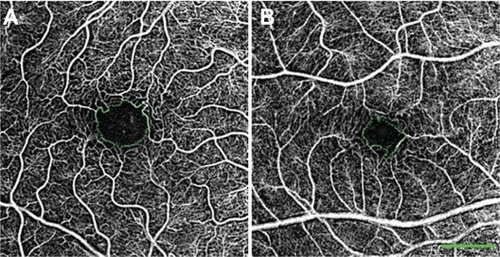
Figure 4 Red-free, nCPM, FA, and OCT images from two patients with BRVO. (A) Red-free image from a 57-year-old male suffering from BRVO with macular edema in the right eye. (B) Corresponding nCPM image (nine series combined into one). (C) Corresponding FA image; green arrows show examples of leaks. The nCPM shows fine vascular detail not visible on the regular red-free image. Macular vascular networks of pathological collateral and connecting channels (red arrows) are shown in detail in the nCPM. (D, E) Corresponding OCT images displaying cystoid macular edema in the region of the abnormal vasculature. (F) nCPM image (nine series combined into one) from a 63-year-old female suffering from BRVO with macular edema in the left eye. (G) Corresponding FA image. The nCPM image demonstrates both nonperfusion (yellow arrows) and detailed neovascularization (red arrows), which correspond with the FA image. (H) Corresponding OCT images displaying edema in the region of the abnormal vasculature.
Abbreviations: BRVO, branch retinal vein occlusion; FA, fluorescein angiography; nCPM, noninvasive capillary-perfusion map; OCT, optical coherence tomography.
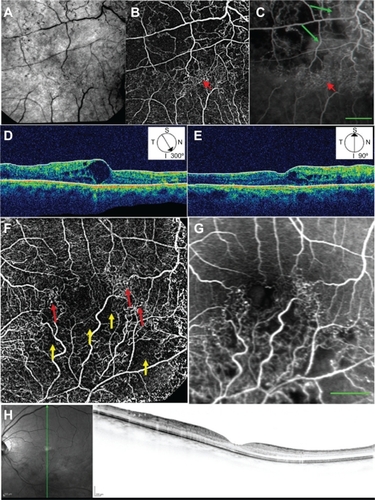
Figure 5 nCPM and FA images from patients with NPDR. (A) nCPM image of the left eye of a 59-year-old male with NPDR (nine series combined into one). (B) Corresponding FA scanning laser ophthalmoscopic image. The nCPM demonstrates vascular loops (red ellipse) and vascular shunts (green arrow). FA images are capable of showing these patterns,Citation22,Citation46 the FA presented here do not show these patterns due to late timing and suboptimal focusing in that area. (C) nCPM image of the left eye of a 60-year-old male with NPDR (eleven series combined into one). (D) Corresponding FA scanning laser ophthalmoscopic image; yellow arrows demonstrate nonperfusion. Most likely better FA images than those obtained here can be accomplished.
Abbreviations: nCPM, noninvasive capillary-perfusion map; FA, fluorescein angiography; NPDR, nonproliferative diabetic retinopathy.
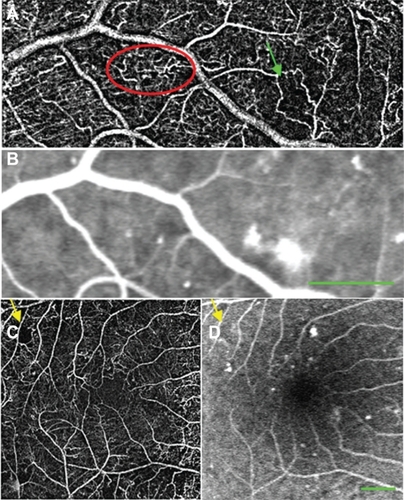
Figure 6 nCPM imaging of patients with PDR. (A) nCPM image of the right eye of a 59-year-old female with PDR demonstrating NVD. (B) Equivalent FA images at different stages after fluorescein injection. (C) nCPM of the right eye of a 50-year-old male with PDR, showing NVD. Note the coarse, tortuous vessels (red arrows) protruding from the optic nerve head surface (green outline), typical of this condition. (D) Corresponding FA images as a function of time, displaying leakage from these vessels. (E) Another example of an nCPM image demonstrating NVD in the left eye of a 68-year-old male with PDR. (F, G) FA (F) and corresponding nCPM (G) images showing abnormal vasculature in the right eye of an 87-year-old female. (H) nCPM image of neovascularization elsewhere in the left eye of a 50-year-old male with PDR.
Abbreviations: FA, fluorescein angiography; nCPM, noninvasive capillary-perfusion map; NVD, neovascularization of the optic disc; PDR, proliferative diabetic retinopathy.
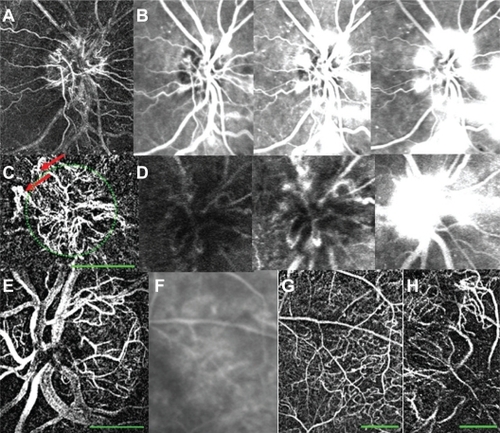
Figure 7 FAZ measurements in healthy subjects and in patients with retinal diseases. (A) A healthy 39-year-old female. Area and diameter, respectively, of FAZ: 0.114 mm2, 464 μm. (B) A 62-year-old female with DR. Area and diameter, respectively, of FAZ: 0.225 mm2, 672 μm. The green dotted line encircles the FAZ. Average over many healthy and DR subject showed similar results (see text).
Abbreviations: DR, diabetic retinopathy; FAZ, foveal avascular zone.
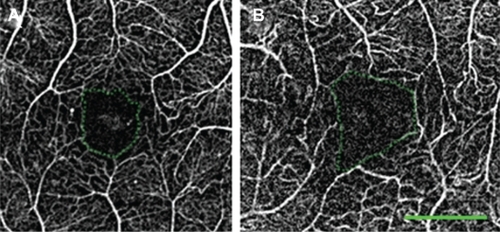
Figure 8 nCPM imaging of an AMD patient. (A) nCPM image (eight series combined into one) from a 73-year-old female suffering from AMD with a neovascular membrane in the right eye. White dots appear as a result of drusen. (B) Corresponding FA image. (C) Corresponding OCT images demonstrating mostly scarred neovascularization combined with some retinal fluid.
Abbreviations: AMD, age-related macular degeneration; FA, fluorescein angiography; nCPM, noninvasive capillary-perfusion map; OCT, optical coherence tomography.
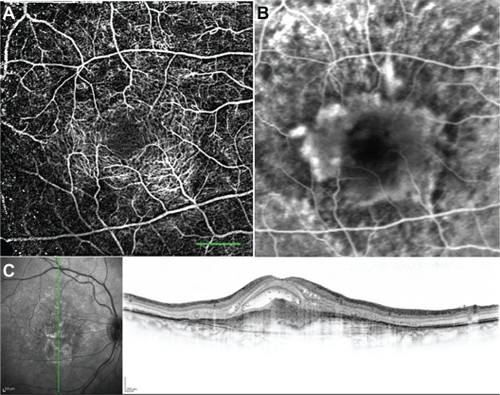
Figure 9 Oral FA for leakage imaging. An nCPM image (A) of a patient with CSR. The nCPM is complemented by oral FA imaging (B) (25 mg/kg)Citation44 that was acquired by the RFI 20 minutes after fluorescein administration, and demonstrates the fluid leakage.
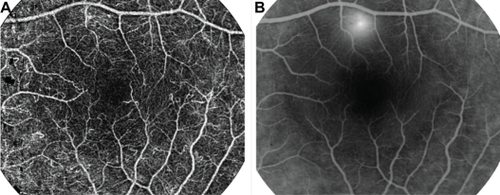
Figure S1 nCPM images of different magnifications. nCPM images produced from images acquired with a diagonal field of 20 degrees (A) and 35 degrees (B). The 20-degree images produce more capillary detail as a result of the limited resolution of the camera. This may change in future, and detailed images would be produced with a better field of view.
Abbreviation: nCPM, noninvasive capillary-perfusion map.
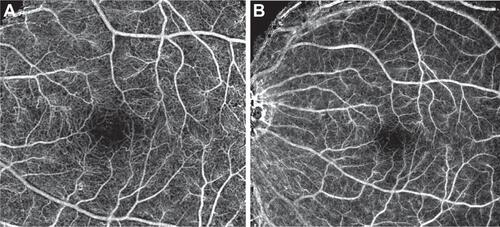
Figure S2 nCPM quality obtained in a single 125-ms session. Examples of three single-series nCPM images. Eight images were realigned to correct eye movements. Differential images were created for each image to eliminate retina pattern. The middle panel produced maps of the best quality, in which even the foveal avascular zone was detectable. These differential images were used to create each of the single-series nCPMs. By combining five overlapping sets of series, it was possible to create an inter-series nCPM image of this healthy subject, as seen in .
Note: Scale bar: 500 μm.
Abbreviation: nCPM, noninvasive capillary-perfusion map.
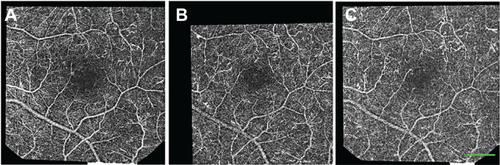
Figure S3 Frames from movies illustrating the procedure from retinal images to the noninvasive capillary-perfusion map (nCPM). (A) Frame of realigned frames of a raw movie; follow the web link to Movie S3A (http://www.youtube.com/watch?v=Fn-W95Yec8o) showing 40 registered raw images. (B) Frame of the corresponding ratio image; Movie S3B shows the ratio images (http://www.youtube.com/watch?v=buPTP4C7j5i); the flow in large vessels can already be detected visually. The nCPM illustrated in C and was calculated by the present algorithm (see Methods) from the motion of small black dots in all such ratio images acquired.
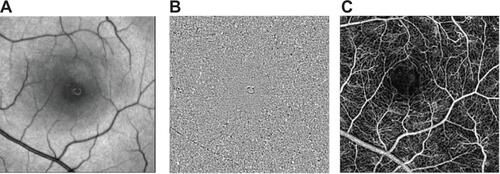
Figure S4 Reproducibility of the nCPMs. Two nCPMs, each produced by averaging five different series.
Note: Scale bar: 500 μm.
Abbreviation: nCPM, noninvasive capillary-perfusion map.
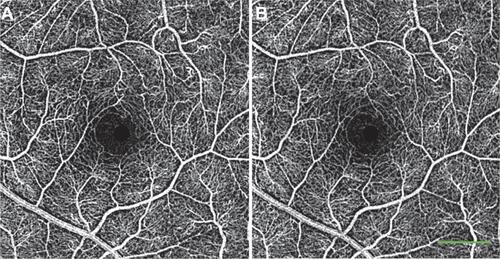
Figure S5 Reproducibility of noninvasive capillary-perfusion map over time. (A, B) Images from a healthy subject taken on two different occasions, 6 months apart.
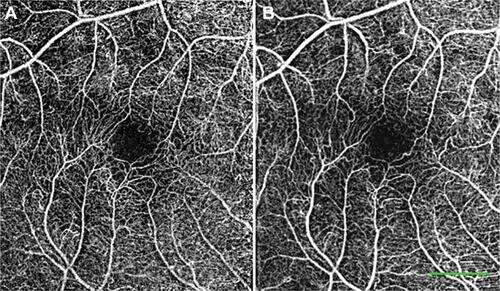
Figure S6 Peripheral noninvasive capillary-perfusion maps. Images from healthy subjects showing the peripheral retinal capillaries in great detail.
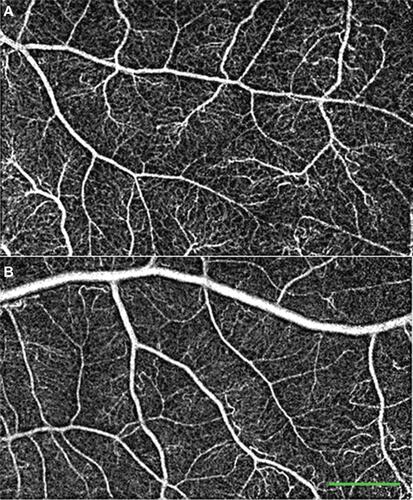
Table S1 A comparison of FA and nCPM images