Figures & data
Figure 1 Ozurdex® injector (left) and pellet (right).
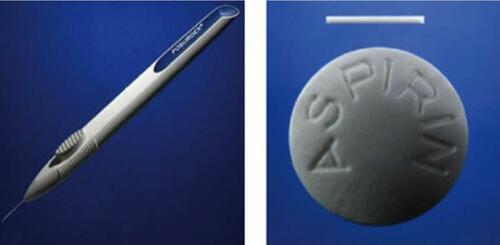
Figure 2 Above is a summary of the mean IOP between treatment and control arms stratified by diagnosis at the time of IOP spike in the cross-sectional group. P-value was <0.05 for each diagnosis. Other = wAMD and CME.
Abbreviations: BRVO, branch retinal vein occlusion; DME, diabetic macular edema; CRVO, central retinal vein occlusion; wAMD, wet age-related macular degeneration; CME, cystoid macular edema; IOP, intraocular pressure; POHx, past ocular history.
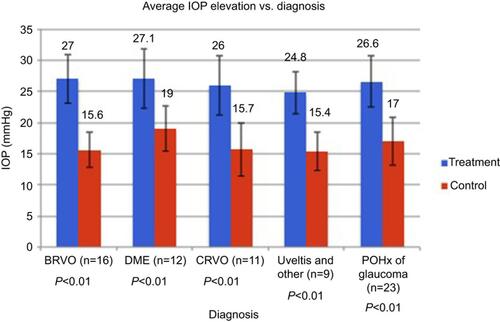
Table 1 Demographic data
Figure 3 Above is a summary of the mean RNFL thicknesses between treatment and control arms stratified by diagnosis. P-value was >0.05 for each diagnosis. Other = wAMD and CME.
Abbreviations: BRVO, branch retinal vein occlusion; DME, diabetic macular edema; CRVO, central retinal vein occlusion; wAMD, wet age-related macular degeneration; CME, cystoid macular edema; POHx, past ocular history; RNFL, retinal nerve fiber layer.
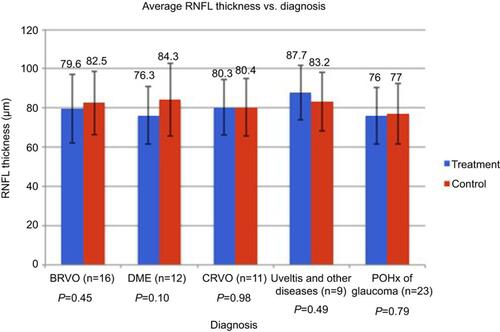
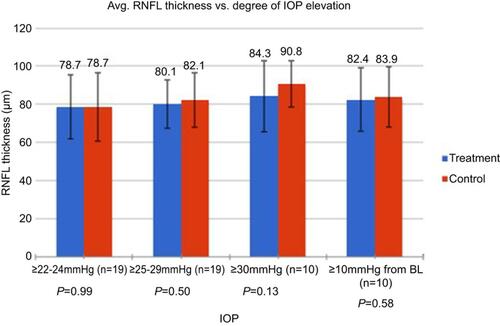
Figure 4 Above summarizes the mean RNFL differences between treatment and control arms stratified by the magnitude of IOP elevation as well as those treated eyes with IOP spikes ≥10 mmHg from baseline IOP. P-value was >0.05 for each group.
Abbreviations: IOP, intraocular pressure; RNFL, retinal nerve fiber layer; BL, baseline; Avg, average.