Figures & data
Figure 1 Schematic representation of the experimental set-up.
Notes: (A) With the Maddox rod. Participants stood upright in front of the visual display, which was at the same height as their eyes. Here, the Maddox screen is represented over the subject's right eye (see “Experimental procedure” section and the supplementary video for details). Participants wore headphones that delivered sounds of 500 or 1,000 Hz (series of 500 ms beeps). During the trials, the subject had to fixate with both eyes on a small light located at the exact center of the visual display. Top: detailed representation of the visual display. Six 8-cm-high drawings, easy for the children to identify, were placed on each side of the visual display (the light always appeared in the center gray zone). Bottom: when the Maddox screen was placed in front of one of the two eyes, the subject sees a combination of the vision of the unoccluded eye (light point in the center and 12 pictures) and of the other eye (a red horizontal line that goes through the light). Each of the two eyes thus sees a different image of the light, and binocular fusion is modified. The subject fixates with both eyes on a light located in the center of 12 easily recognized images. (B) With the red laser beam. Here, the red line is produced by a laser beam projected through the center of this light. Because both eyes see the same image, there is no change in binocular vision.
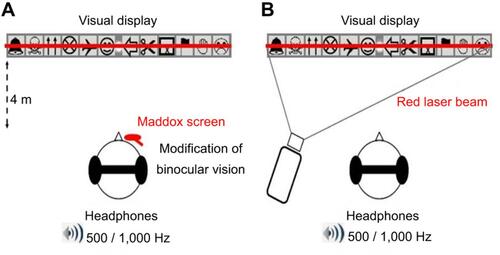
Table 1 Visual assessment
Figure 2 Example of a subject verbally reporting a VS.
Note: While fixating on the visual display, if the subject experienced a VS they had to press a handheld button their right hand and say clearly to the experimenter from where the “red line” had disappeared, in this case at the level of the left-oriented arrow and the scissors.
Abbreviation: VS, visual scotoma.
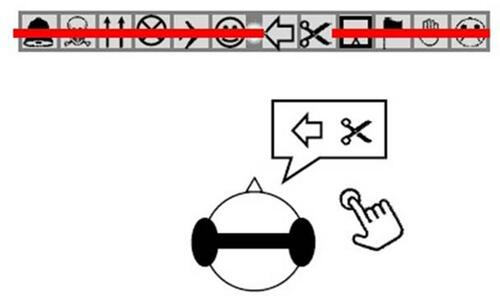
Figure 3 Occurrence and size of the VS phenomenon during the different experimental conditions.
Notes: (A) Mean percentage (± SE) of VS occurrence for the different conditions of binocular vision and for both sound frequencies. (B) Mean size (± SE) of VS for the different experimental conditions. Note that the values are expressed as number of “vanished pictures”. *P<0.05
Abbreviation: VS, visual scotoma.
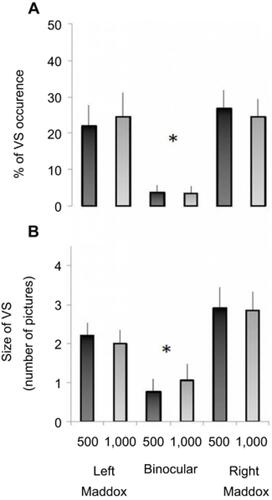
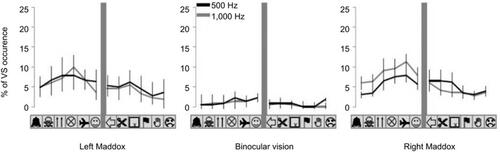
Figure 4 “Topography” or spatial distribution of VS within the visual display is represented for each experimental condition.
Note: For each condition of binocular vision and sound frequency, the graphs indicate mean percentage (± SE) of VS occurrence for each picture location.
Abbreviation: VS, visual scotoma.