
Figures & data
Figure 1 Central serous retinopathy (CSCR) patients in treatment and control groups both had comparable visual acuity and central macular thickness at the initial presentation. There is no statistical significance between the two groups. Bars represent mean ± standard error of the mean.
Abbreviation: ETDRS, Early Treatment Diabetic Retinopathy Study.
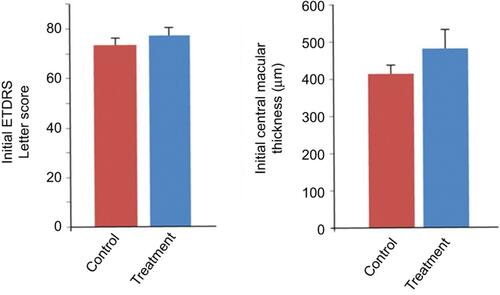
Figure 2 The percentage reduction is calculated as [(Original volume – Follow-up volume)]/(Original Volume)*100%, and incorporated as bar graphs with increments of 10% ranging from “0%” to “100%”. Each bar graph represents the number of patients in that percentage group range. In comparison to the control group, patients in the treatment group had higher tendencies for having full resolution of central serous chorioretinopathy (CSCR). The majority of patients in the control/observation group, on the other hand, had no or minimal improvement in the subretinal fluid volume at follow-up visit.
![Figure 2 The percentage reduction is calculated as [(Original volume – Follow-up volume)]/(Original Volume)*100%, and incorporated as bar graphs with increments of 10% ranging from “0%” to “100%”. Each bar graph represents the number of patients in that percentage group range. In comparison to the control group, patients in the treatment group had higher tendencies for having full resolution of central serous chorioretinopathy (CSCR). The majority of patients in the control/observation group, on the other hand, had no or minimal improvement in the subretinal fluid volume at follow-up visit.](/cms/asset/0580a557-8e55-4b1b-a2c1-f90bdbf11d54/doph_a_12176395_f0002_c.jpg)
Figure 3 Panel A – central macular thickness reductions in the control and treatment groups were 43.5 µm and 196.2 µm, respectively (p<0.006). Panel B – percentage reductions of subretinal fluid volume were 11.1% and 64.3% in the control and treatment groups, respectively (p<0.02). Bars represent mean ± standard error of the mean.
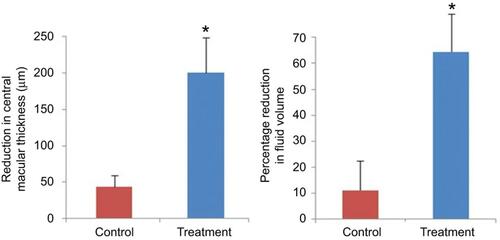
Figure 4 Changes in the visual acuity score were 0.69 letters for the control group and 5.2 letters for the treatment group (p-value=0.067). Bars represent mean ± standard error of the mean.
Abbreviation: ETDRS, Early Treatment Diabetic Retinopathy Study.
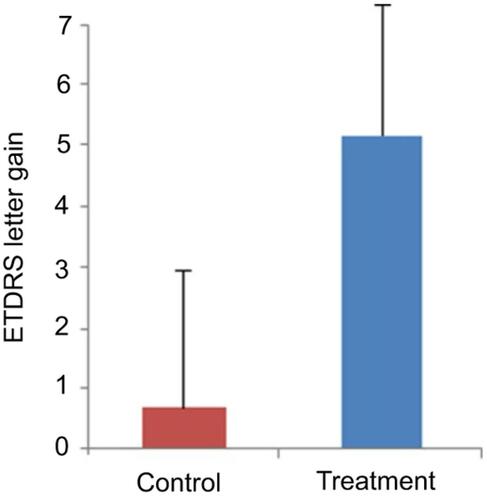
Table 1 Clinical characteristics of patients who were either treated or observed for acute central serous chorioretinopathy