
Figures & data
Figure 1 Flowchart describing the process of identification of patients who met the inclusion/exclusion criteria. Numbers refer to the number of patients at each stage of the process.
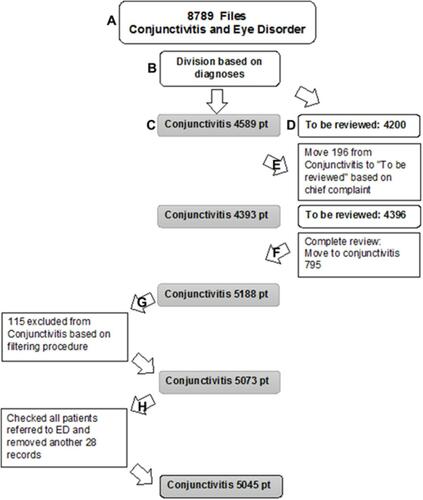
Table 1 Age and gender distribution of conjunctivitis cohort
Figure 2 Distribution of conjunctivitis by age and gender. The red and the blue lines represent females and males, respectively.
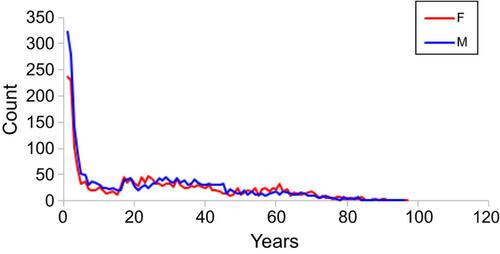
Table 2 Age distribution in conjunctivitis, UCC and ED cohorts
Table 3 Age distribution of UCC and ED conjunctivitis patients
Table 4 Patients presenting with conjunctivitis and total UCC by day of the week