Figures & data
Table 1 Baseline characteristics of the study population
Figure 1 The mean changes from baseline in the subject-reported symptoms of ocular dryness/irritation assessed by visual analog scale (VAS) on a 0–100 scale (0= no ocular dryness/irritation, 100= severe ocular dryness/irritation) are presented by visit. The mean changes from baseline were considered statistically significant at week 4 and week 8 (p<0.01), and week 12 (p<0.001). A paired t-test was used to analyze within-group changes from baseline.
Abbreviations: SD, standard deviation; VAS, visual analog scale.
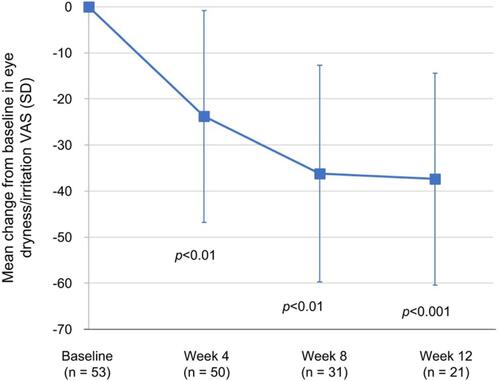
Figure 2 The mean changes from baseline in the corneal fluorescein staining on a 0–20 scale (0–4 scale per region for each of the 5 regions of the cornea) are presented by visit. Analysis of the mean changes from baseline in corneal fluorescein staining indicated that the improvements were statistically significant at week 4 (p<0.01), week 8 (p<0.01), and week 12 (p<0.001). A paired t-test was used to analyze within-group changes from baseline.
Abbreviation: SD, standard deviation.
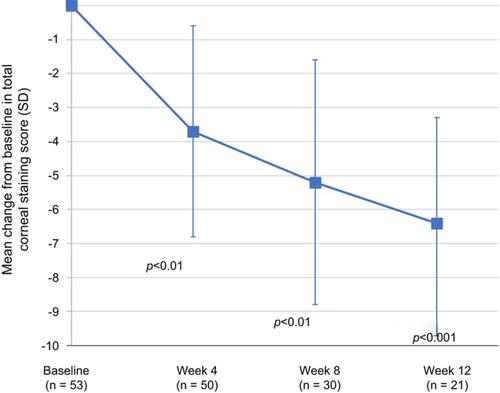
Figure 3 The mean changes from baseline in the conjunctival lissamine green staining on a 0–18 scale (0–3 scale per region for each of the 6 regions of the conjunctiva) are presented by visit. Changes from baseline were determined to be statistically significant at week 4 (p<0.01), week 8 (p<0.01), and week 12 (p<0.001). A paired t-test was used to analyze within-group changes from baseline.
Abbreviation: SD, standard deviation.
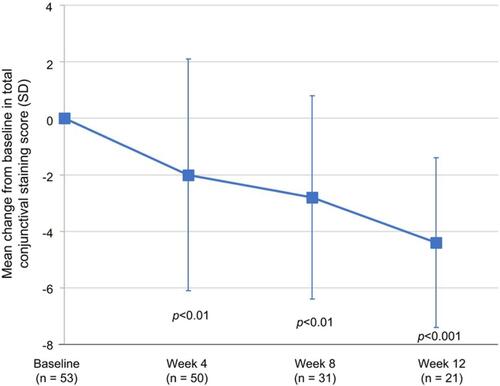
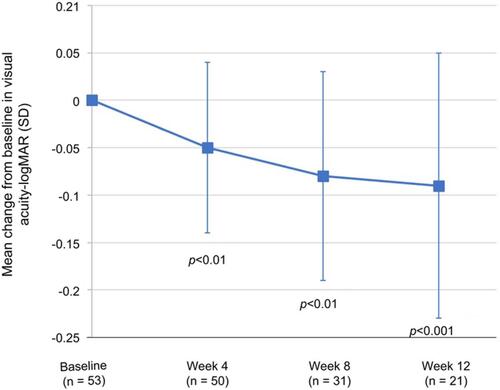
Figure 4 The mean changes from baseline in visual acuity (LogMAR) are presented by visit. SD = standard deviation. The improvement from baseline at follow-up visits was statistically significant at week 4 (p<0.01), week 8 (p<0.01), and week 12 (p<0.001). A paired t-test was used to analyze within-group changes from baseline.
Abbreviation: SD, standard deviation.