
Figures & data
Figure 1 VISCO360® Viscosurgical System. (A) Illustration of the device showing a handpiece with a microcatheter, control wheel for advancing and retracting the microcatheter, viscoelastic reservoir/infusion pump, and a locking mechanism. (B) Schematic of circumferential viscodilation of Schlemm’s canal (SC) through clear corneal incision. VISCO360® cannula tip creates an opening into SC. A controlled volume of viscoelastic fluid is delivered as the microcatheter is retracted back. VISCO360 Viscosurgical System.
Note: Images are sourced from Sight Sciences, http://sightsciences.com and used with permission.
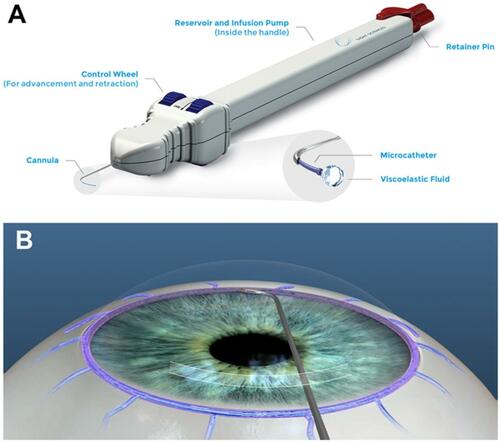
Figure 2 Ab-interno 360° microcatheterization and viscodilation of Schlemm’s canal (SC) using the VISCO360® in a human eye. VISCO360® cannula (indicated by star) was positioned at the desired location in anterior chamber angle through clear corneal incision (A) and an opening into SC was created with the cannula tip (B), the finger wheel was used to gently advance the microcatheter (indicated by arrow) out of the cannula and into SC (C). As the microcatheter was retracted back out of SC and into the cannula, a controlled volume of viscoelastic fluid was delivered thereby dilating SC along its entire length (D).
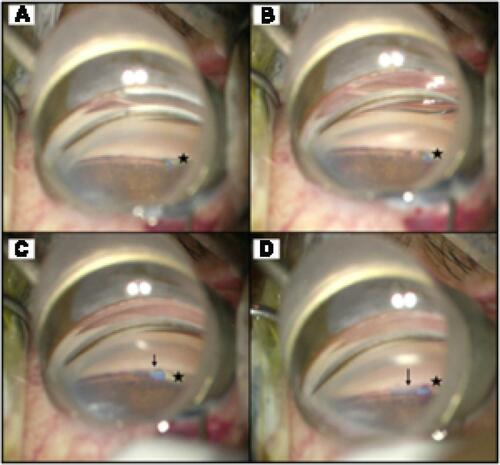
Table 1 Patient demographics at baseline
Figure 3 Mean intraocular pressure (IOP) over time in Group 1. Effectiveness seen as a significant drop in mean IOP at postoperative Day 1 which remained similar across all postoperative visits until Month 12. *Statistically significant reduction (P<0.001). Error bars, SD.
Abbreviations: BL, baseline; D, day; M, month; n, number of eyes available for analysis.
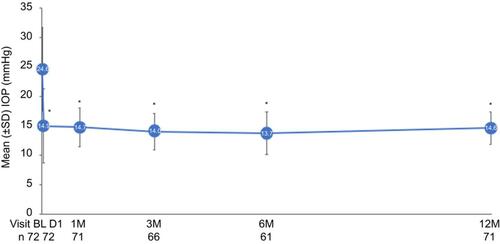
Figure 4 Reduction in intraocular pressure (IOP) by ≥20% with same or fewer medications in Group 1. The figure shows the proportion of eyes meeting the outcome measure with no increase in IOP-lowering medications over time.
Abbreviation: N, number of eyes available for analysis.
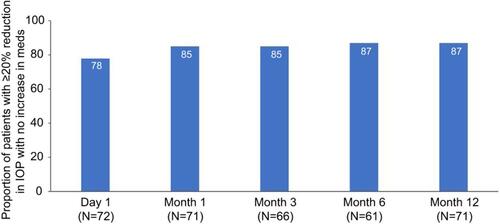
Figure 5 Mean number of intraocular pressure (IOP)-lowering medications over time in Group 1. *Statistically significant reduction (P<0.001). Error bars, SD.
Abbreviations: BL, baseline; D, day; M, month; n, number of eyes available for analysis.
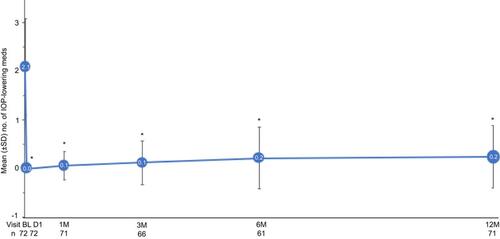
Figure 6 Proportion of patients who achieved medication independence without an increase in intraocular pressure (IOP) as compared to baseline in Group 1.
Abbreviation: N, number of eyes available for analysis.
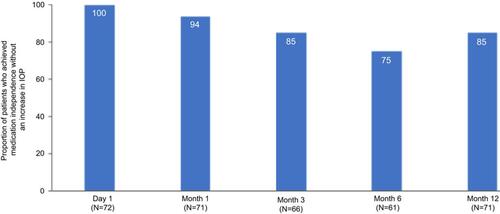
Table 2 Effectiveness outcomes in VISCO360-alone subgroup (n=11)
Figure 7 Mean intraocular pressure (IOP) over time in Group 2. Effectiveness seen as no change in mean IOP across all postoperative visits up to Month 12 as compared to baseline (P>0.05). Error bars, SD.
Abbreviations: BL, baseline; D, day; M, month; n, number of eyes available for analysis.
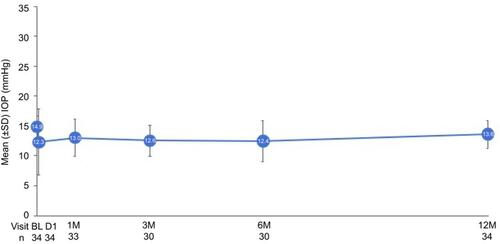
Figure 8 Mean number of intraocular pressure (IOP)-lowering medications over time in Group 2. *Statistically significant reduction compared to baseline (P<0.001). Error bars, SD.
Abbreviations: BL, baseline; D, day; M, month; n, number of eyes available for analysis.
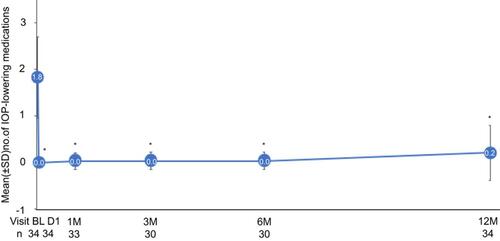
Figure 9 Proportion of eyes achieving medication independence without an increase in intraocular pressure (IOP) as compared to baseline in Group 2.
Abbreviation: N, number of eyes available for analysis.
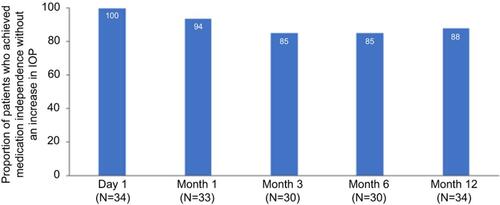
Table 3 Ocular adverse events
Table 4 Comparison of VISCO360 results for Group 1 (baseline-IOP ≥18 mmHg) to iTrackCitation11 and iStentCitation17 studies