Figures & data
Table 1 Baseline demographic, clinical and topographic parameters for two pulsed-light-accelerated CXL protocols
Table 2 Visual, topographic and functional outcomes for two different pulsed-light-accelerated CXL modalities at 12 months follow-up
Figure 1 AS-OCT of corneal stromal demarcation line at postoperative month 1 in after pulsed-light-accelerated CXL with 30 mW/cm2 (A) and 45 mW/cm2 (B) irradiances.
Abbreviation: CXL, corneal crosslinking.
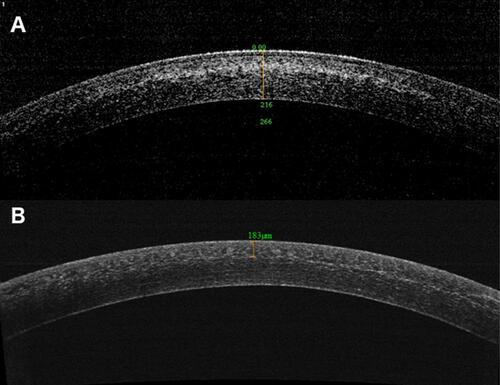
Table 3 Postoperative change in visual acuity, refractive error and topography at 12 months
Table 4 Percentage of regression (>1D decrease in Kmax in 12 months), stabilization (no more than 1D change in Kmax) and progression (>1D increase in Kmax in 12 months) of keratoconus
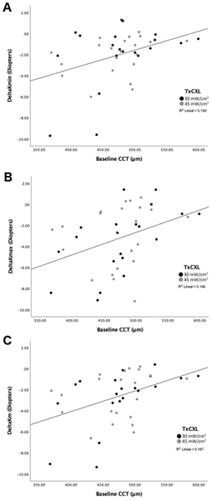
Figure 2 Pearson´s correlation between baseline CCT and (A) ΔKmin (r=0.381, p=0.014), (B) ΔKmax (r=0.473, p=0.002) and (C) ΔKm (r=0.517, p=0.001).
Abbreviation: CCT, central corneal thickness.