Figures & data
Table 1 Demographics for cataract + trabecular microbypass–stent group and cataract-only group
Figure 1 Difference between spherical equivalent outcome and target.
Notes: Ratio of cases with spherical equivalent outcome within a certain number of designated diopters of target spherical equivalent. Blue bars represent cataract-only cases. Orange bars represent cases of cataract surgery with trabecular microbypass stent. TOST equivalence testing showed the spherical outcomes of the two groups were equivalent (t124=4.5, P<0.0001).
Abbreviation: TOST, two one-sided test.
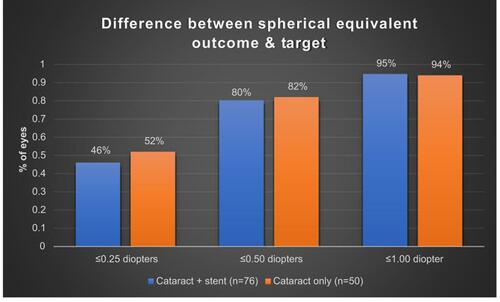
Figure 2 Magnitude of preoperative corneal astigmatism and postoperative refractive astigmatism in patients with combined cataract surgery with trabecular microbypass stent.
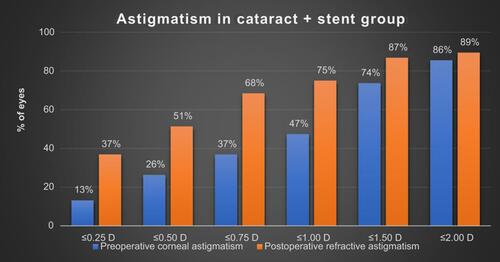
Figure 3 Magnitude of preoperative corneal astigmatism and postoperative refractive astigmatism in patients with cataract surgery only.
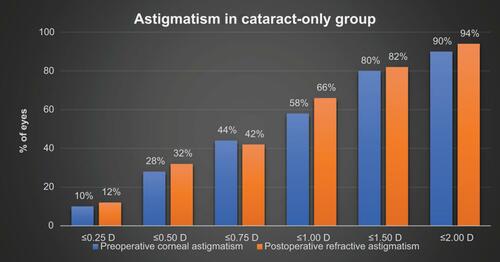
Figure 4 Double-angle plot showing preoperative and postoperative astigmatic vectors and their means and spread for the combined cataract surgery with trabecular microbypass–stent group.
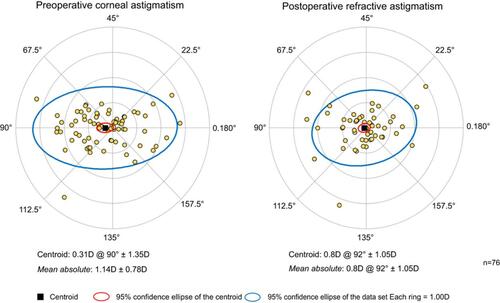
Figure 5 Double-angle plot showing preoperative and postoperative astigmatic vectors and their means and spread for the cataract surgery–only group.
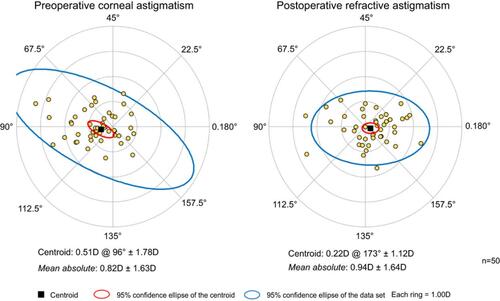
Figure 6 Distribution of different lens types (monofocal, multifocal, and toric) for the combined-surgery group and the cataract-only group.
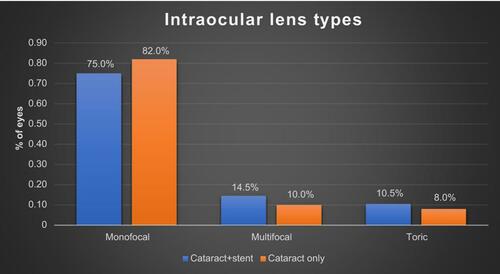
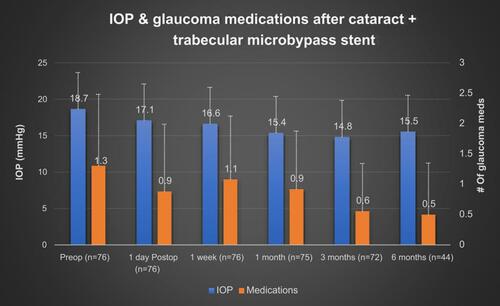
Figure 7 Mean intraocular pressure (IOP) and number of glaucoma medications from baseline to 6 months postoperatively in eyes implanted with a trabecular microbypass stent during cataract surgery.
Note: Error bars represent SD.