
Figures & data
Figure 1 OCT macula done in choroidal mode showing sclero-choroidal interface.
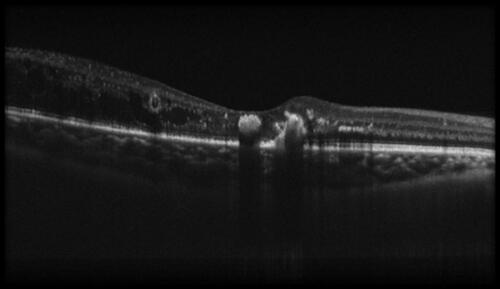
Figure 2 Measurement of choroidal thickness. (A) The sclero-choroidal interface is marked manually. (B) The line connects the marked points automatically by the software. (C) Measurement is done automatically between the outer choroid line and retinal pigment epithelium.
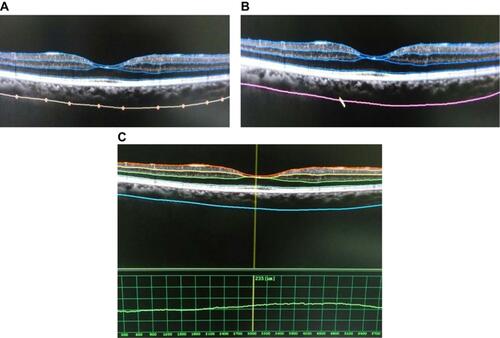
Table 1 Demographic and clinical data of the three groups
Table 2 Data of the three groups