
Figures & data
Table 1 Baseline Demographic And Glaucoma Status Data
Table 2 Surgical Success Rates (≥20% IOP Reduction Or ≥1 Medication Reduction Without Additional IOP-Lowering Procedures), Mean IOP, And Mean Medication Data For Both Groups At Each Time Point
Figure 1 IOP for sectoral excisional goniotomy with KDB or Trab360/GATT in the 6-month follow-up period.
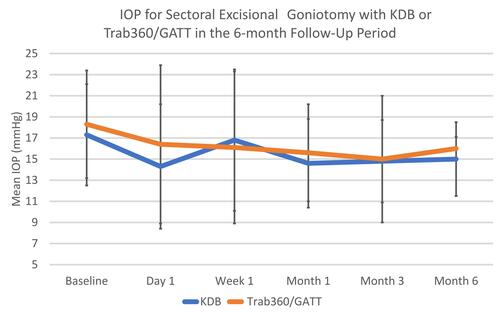
Figure 2 IOP-lowering medications for sectoral excisional goniotomy with KDB or Trab360/GATT in the 6-month follow-up period.
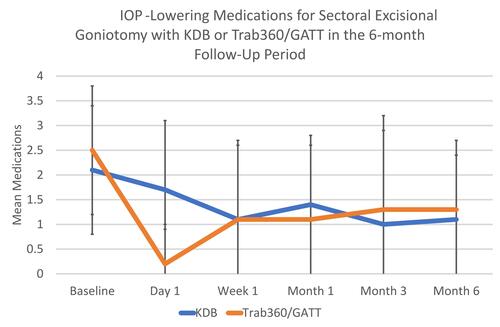
Table 3 The Nature And Frequency Of Adverse Events And Additional IOP-Lowering Procedures By Group, N (%)