Figures & data
Table 1 Subject demographics
Table 2 Habitual contact lenses
Table 3 Study lens parameters
Table 4 Least square (LS) mean difference estimates and 95% confidence intervals (CI) of corneal thickness (µm) along horizontal meridian measured with OCT
Figure 1 Open-eye corneal thickness (LS mean±CI) across the cornea (OCT) in hyperopes (top) and myopes (bottom) (overall values are not shown to prevent crowding).
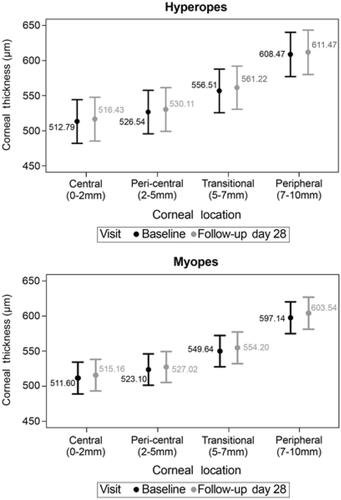
Table 5 Least square (LS) mean difference estimates and 95% confidence intervals (CI) of objective bulbar and limbal hyperemia by Oculus K5M
Table 6 Least square (LS) mean difference estimates and 95% confidence intervals (CI) of graded lid wiper epitheliopathy
Figure 2 Open-eye objective (Oculus K5M) bulbar (top) and limbal (bottom) hyperemia (LS mean±CI).
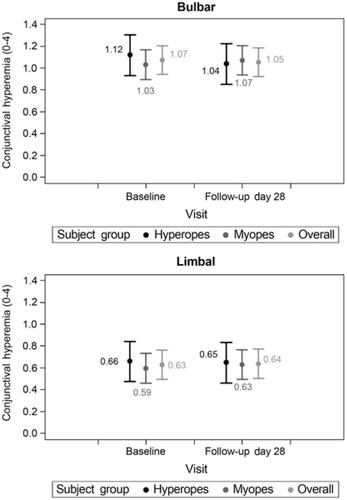
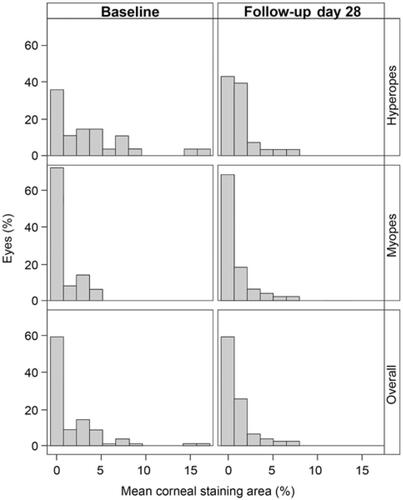
Figure 3 Frequency (%) of graded mean corneal staining area (%).