Figures & data
Table 1 Patient Demographics And Baseline Disease Characteristics Of OCEAN RVO Population (Full Analysis Set)
Figure 1 Visual acuity over the course of 24 months, overall RVO population. (A) Development of mean BCVA over time; (B) Mean difference in BCVA from baseline to study visits; (C) Number of patients who discontinued prematurely over the course of 24 months.
Notes: aLast documented BCVA result in first year of study (LOCF). bLast documented BCVA result in entire study period (LOCF). Boxes and error bars: mean values and 95% confidence intervals; grey bars: number of patients per visit; red bars: numbers of patients who discontinued.
Abbreviations: BCVA, best-corrected visual acuity; BL, baseline; ETDRS, Early Treatment for Diabetic Retinopathy Study; LOCF, last observation carried forward; logMAR, logarithm of the minimum angle of resolution; RVO, retinal vein occlusion.
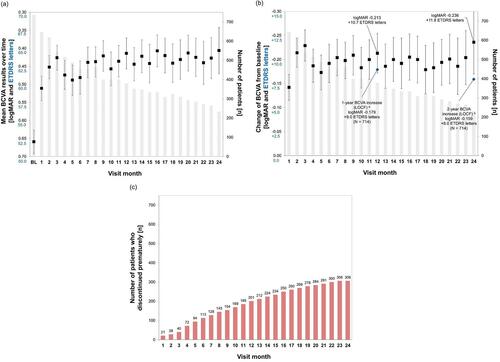
Table 2 Best-Corrected Visual Acuity Over The Course Of The OCEAN Study (Full Analysis Set)
Figure 2 Visual acuity over the course of 24 months in BRVO and CRVO subgroups. (A) Development of mean BCVA over time; (B) Mean difference in BCVA from baseline to study visits.
Note: Boxes and error bars: mean values and 95% confidence intervals.
Abbreviations: BCVA, best-corrected visual acuity; BL, baseline; BRVO, branch retinal vein occlusion; CRVO, central retinal vein occlusion; ETDRS, Early Treatment for Diabetic Retinopathy Study; logMAR, logarithm of the minimum angle of resolution.
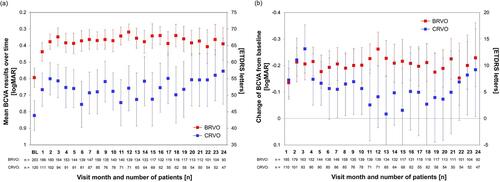
Figure 3 Time to discontinuation. (A) In all patients and (B) In BRVO and CRVO subgroups.
Notes: If the time of discontinuation was not documented, it was set to day 1. Estimators are based on the Kaplan-Meier product-limit methodology.
Abbreviations: BL, baseline; BRVO, branch retinal vein occlusion; CRVO, central retinal vein occlusion; KM, Kaplan-Meier; mo, months.
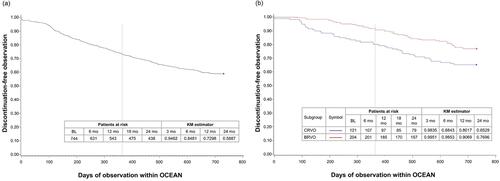
Figure 4 Time to response (BCVA improvement of ≥15 ETDRS letters from baseline). (A) In all patients and (B) In BRVO and CRVO subgroups.
Notes: Time to response was defined as the first time an improvement of ≥15 ETDRS letters from baseline was reached. Participants who did not reach a response were censored at the last documented time point. If no visual acuity data were documented after baseline, the participant was censored on day 1. Estimators are based on the Kaplan-Meier product-limit methodology.
Abbreviations: BCVA, best-corrected visual acuity; BL, baseline; BRVO, branch retinal vein occlusion; CRVO, central retinal vein occlusion; ETDRS, Early Treatment for Diabetic Retinopathy Study; KM, Kaplan-Meier; mo, months.
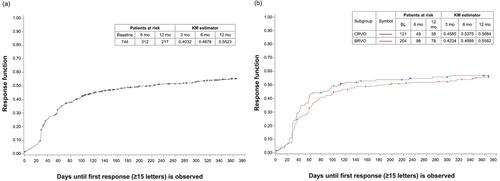
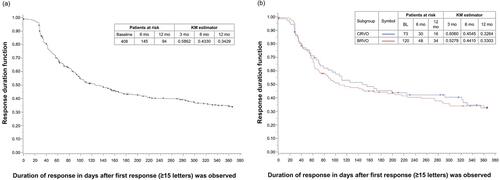
Figure 5 Duration of response (time from first BCVA improvement of ≥15 ETDRS letters to losing this improvement). (A) In all patients and (B) In BRVO and CRVO subgroups.
Notes: Duration of response was defined as the time from first improvement of ≥15 ETDRS letters from baseline to the first time point of losing this improvement. Participants who did not lose the response were censored at the last documented time point where the response was still present. If no visual acuity data were documented after the response date, the participant was censored on day 1. Estimators are based on the Kaplan-Meier product-limit methodology.
Abbreviations: BCVA, best-corrected visual acuity; BL, baseline; BRVO, branch retinal vein occlusion; CRVO, central retinal vein occlusion; ETDRS, Early Treatment for Diabetic Retinopathy Study; KM, Kaplan-Meier; mo, months.