
Figures & data
Table 1 Average [mean±standard deviation or median (interquartile range)] for the OSDI, PRT1, PRT2, TBUT1, TBUT2, and TF scores for the study and control groups
Figure 1 The side-by-side boxplot for the PRT (OD) within the study and control groups. Statistically significant at P<0.05.
Abbreviation: PRT, phenol red thread.
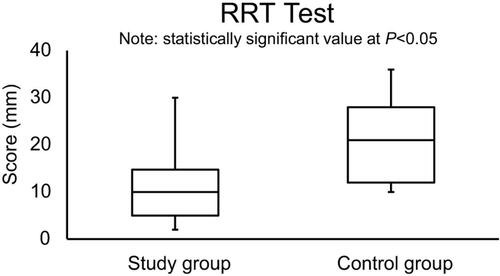
Figure 2 The side-by-side boxplot for the TUBT (OD) within the study and control groups. Statistically significant at P<0.05.
Abbreviation: TBUT, tear break-up time.
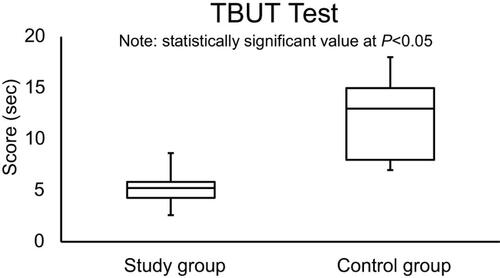
Figure 3 The side-by-side boxplot for the TF test within the study and control groups. Statistically significant at P<0.05.
Abbreviation: TF, tear ferning.
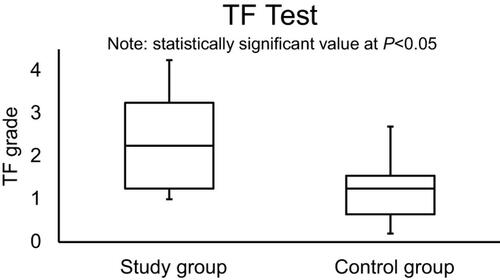
Figure 4 Examples of TF images obtained from the study group (showing dry eye conditions in most cases).
Abbreviation: TF, tear ferning.
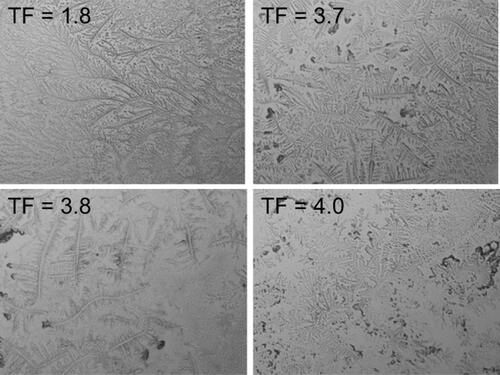
Figure 5 Examples of TF images obtained from the control group (showing normal eye conditions in all cases).
Abbreviation: TF, tear ferning.
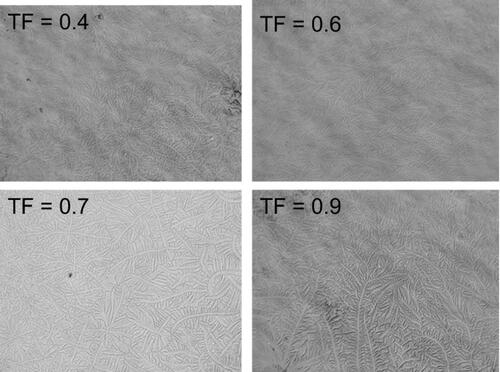
Table 2 Correlation of the OSDI, PRT, TBUT (OD), and TF scores for the study group (N=20)*
Table 3 Average (mean±standard deviation or median [interquartile range]) for the OSDI, PRT1, PRT2, TBUT1, TBUT2, and TF scores within hypothyroidism and hyperthyroidism subjects