
Figures & data
Table 1 Patients’ demographics and clinical tests in dry eye disease and controls
Table 2 Correlation between subjective and objective metrics in dry eye disease
Figure 1 Dynamic changes of objective scatter index (OSI) of an illustrative case in the control (A) and dry eye disease groups (B–D). A) Steady-low value of OSI; (B) ladder pattern displayed ascending values of OSI; (C) seesaw pattern revealed repeatedly fluctuation of OSI; (D) plateau pattern showed a steady-high value of OSI.
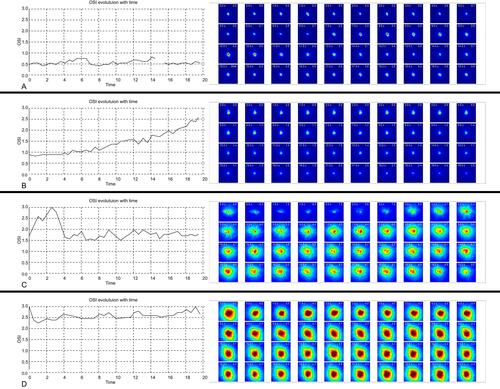
Table 3 Subjective and objective tests in the DED subgroups