Figures & data
Figure 1 Case 1. Fundus photograph. Massive yellowish lesion, temporal to fovea, with an exudative detachment involving the fovea and choroidal folds.
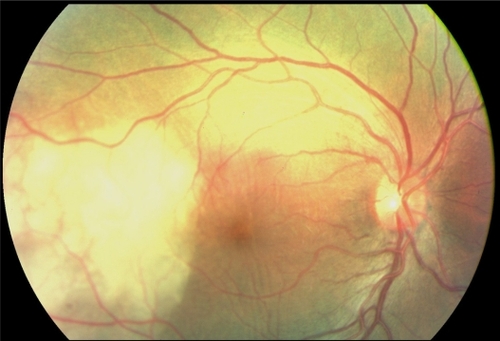
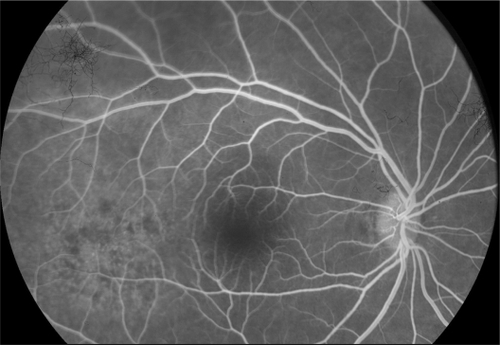
Figure 2 Case 1. Fluorescein angiography sequence. Pronounced choroidal folds and early hyperfluorescence, with leakage and some pin points.
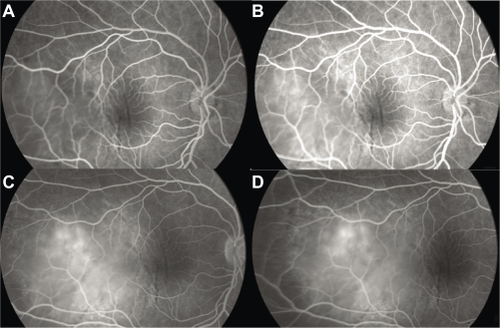
Figure 3 Case 1. B-scan ultrasonography. Thickening of the ocular coats associated with subretinal fluid adjacent to the mass (A). There is no orbital shadowing. Mass was prominent in the vitreous cavity and measured 11 mm × 4.6 mm (B).
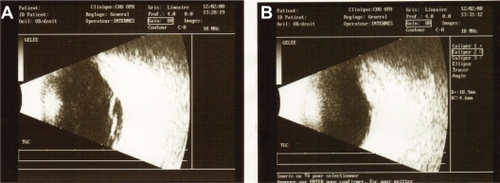
Figure 4 Case 2. Fundus photograph. Unique and massive orange-yellow protruding lesion temporal to macula with an exudative detachment involving the fovea and extending inferiorly.
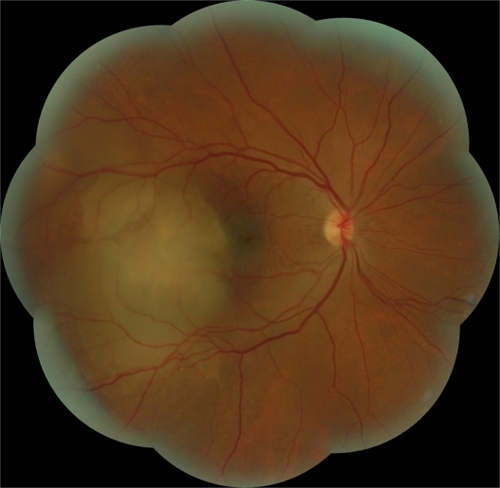
Figure 5 Case 2. Fluorescein angiography sequence. Progressive and heterogeneous hyperfluorescence, with pin points temporal to the mass.
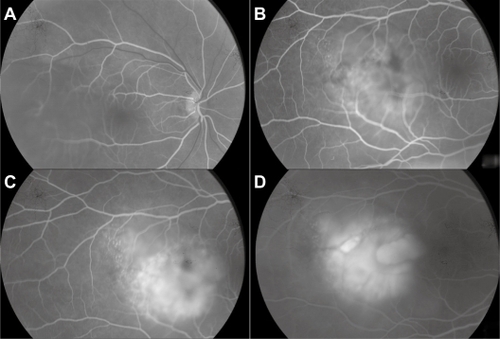
Figure 6 Case 2. Optical coherence tomography. Serous retinal detachment and elevation of the retina depending on a choroidal mass.
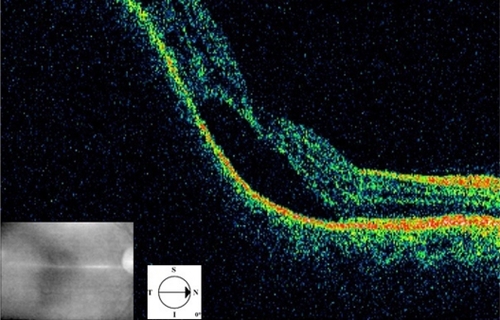
Figure 7 Case 2. Brain magnetic resonance imaging in FLAIR (fluid-attenuated inversion recovery sequence) (A), T1 weighted with gadolinium (B) and STIR (short-tau inversion recovery sequence) (C). The nodular lesion appears in well limited hypersignal in the right eye, with no gadolinium enhancement. The hypersignal is most prominent in the STIR sequence.
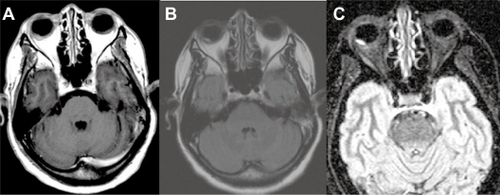
Figure 8 Case 2. Fluorescein angiography 2 weeks after the first examination. Punctuated hyperfluorescence in place of the initial lesion, suggesting retinal pigment epithelium atrophy.