Figures & data
Figure 1 (A) ONH blood flow acquired by LSFG. “1” represents region of interest inside ONH. (B) The black area shows MBR-T and the white area shows MBR-V. (C) CpVD “area a” represents a vascular density of 250-μm-wide elliptical annulus around the optic disc. IpVD “area b” represents a vascular density of 1.5×1.5-mm scan field centered on the ONH.
Abbreviations: ONH, optic nerve head; LSFG, laser speckle flowgraphy; MBR-T, tissue mean blur rate; MBR-V, vascular mean blur rate; cpVD, circumpapillary vessel density; ipVD, intra-papillary vessel density.
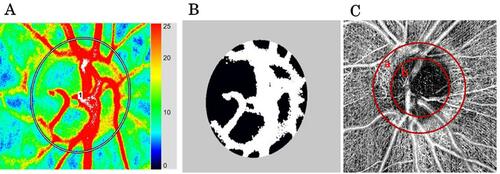
Table 1 Age, sex, MD, and refractive error in each group
Table 2 MBR-V and cpVD in various layers
Table 3 Intra-papillary vessel density in various layers
Figure 2 (A) ONH tissue blood flow (MBR-T, mean ± standard error) changes in normal subjects and patients in each glaucoma stage. P<0.001 (one-way ANOVA), *P<0.01 (Dunnett’s test). (B) Retinal outer layer cpVD changes (mean ± standard error) in each glaucoma stage. P=0.02 (one-way ANOVA), *P<0.01 (Dunnett’s test).
Abbreviations: n.s, not significant; ONH, optic nerve head; MBR-T, tissue mean blur rate; cpVD, circumpapillary vessel density.
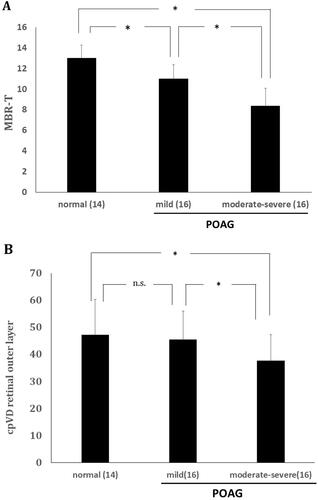
Table 4 Correlation between cpVD and MBR-T or MBR-V in various layers
Table 5 Correlation between ipVD and MBR-T or MBR-V in various layers
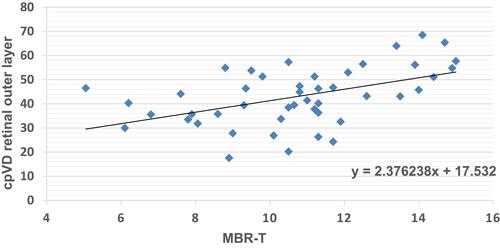
Figure 3 Correlation between retinal outer layer cpVD and MBR-T. P=0.0005, r=0.49 (univariate regression analysis).
Abbreviations: MBR-T, tissue mean blur rate; cpVD, circumpapillary vessel density.