Figures & data
Figure 1 (A) Demographics and outcomes of eyes that underwent primary SB for RRD. (B) Demographics and outcomes of eyes that underwent primary SB/PPV for RRD.
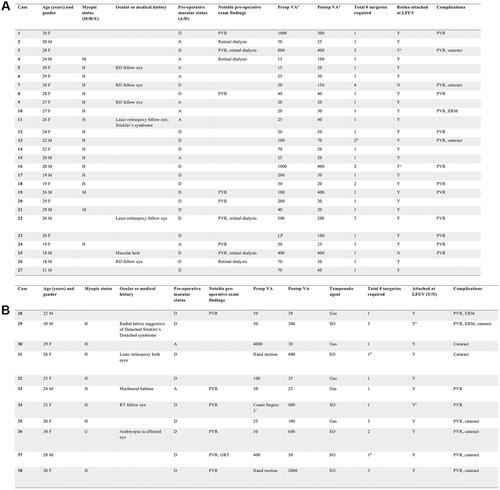
Figure 2 Surgical outcomes. Single surgery anatomical success (SSAS) rate for all eyes was 27/38 (71%). SSAS for SB alone was 20/27 (74%) and for SB/PPV was 7/11 (64%) (p=0.43). Overall anatomic success (OAS) rate at the last follow-up visit was 36/38 (95%). OAS for eyes that underwent primary SB and primary SB/PPV was 25/27 (93%) and 11/11 (100%), respectively.
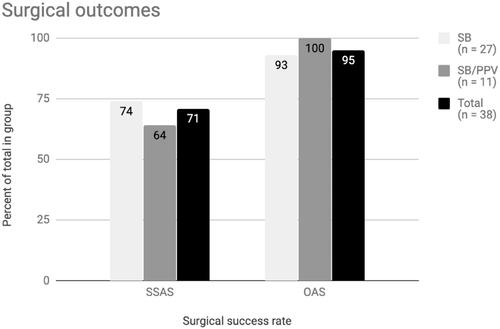
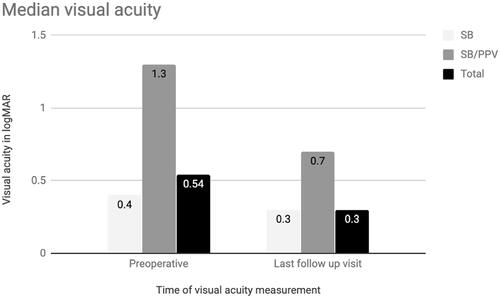
Figure 3 Visual acuity outcomes. Median preoperative Snellen VA was 20/70 (median LogMAR VA 0.54, mean LogMAR 0.82, SD 0.86). For eyes that underwent primary SB, median preoperative Snellen VA was 20/50 (LogMAR 0.40). For eyes that underwent primary SB/PPV, median preoperative Snellen VA was 20/400 (LogMAR 1.30, p=0.02). The overall median Snellen VA at last examination was 20/40 (median LogMAR 0.30, mean LogMAR 0.55, SD 0.56). Median postoperative Snellen VA for eyes that underwent primary SB was 20/40 (LogMAR 0.30). For the primary SB/PPV group, median postoperative Snellen VA was 20/100 (LogMAR 0.70, p=0.05).