Figures & data
Table 1 Baseline characteristics of 27 subjects with diabetic macular edema randomized to receive intravitreal 0.01 mL (40 μg), 0.03 mL (120 μg), or 0.05 mL (200 μg) of the 4 mg/mL dexamethasone solution
Figure 1 Mean change and 95% CI in macular thickness from baseline over time for the overall cohort, in µm.
Abbreviation: D, days after injection.
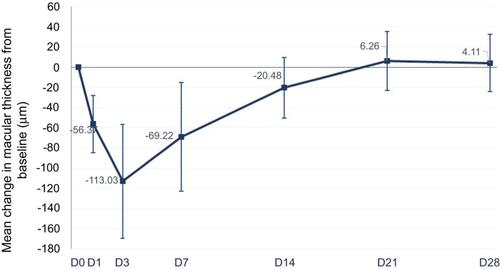
Figure 2 Mean change and 95% CI in macular thickness from baseline over time for each group, in µm.
Abbreviation: D, days after injection.
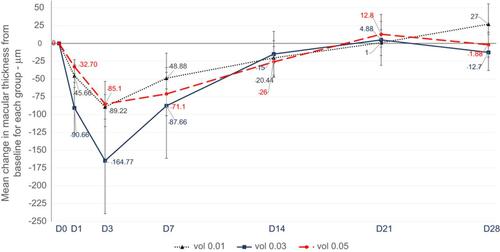
Figure 3 Mean change and 95% CI in visual acuity from baseline over time for the overall cohort, in ETDRS letter score.
Abbreviations: D, days after injection; ETDRS, Early Treatment Diabetic Retinopathy Study.
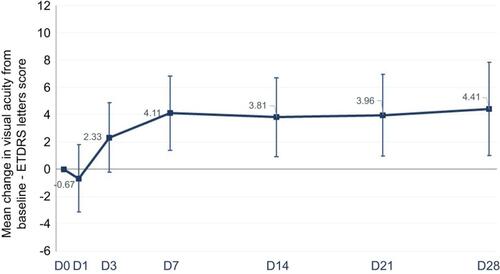
Figure 4 Mean change and 95% CI in visual acuity from baseline over time for each group, in ETDRS letter score.
Abbreviations: D, days after injection; ETDRS, Early Treatment Diabetic Retinopathy Study.
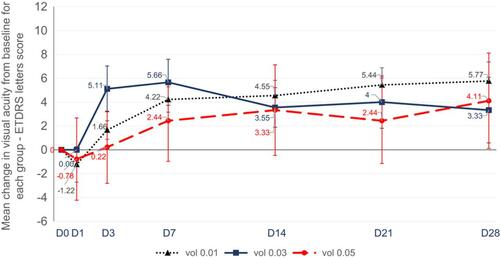
Figure 5 Mean change and 95% CI in intraocular pressure (IOP) from baseline over time for the overall cohort, in mmHg.
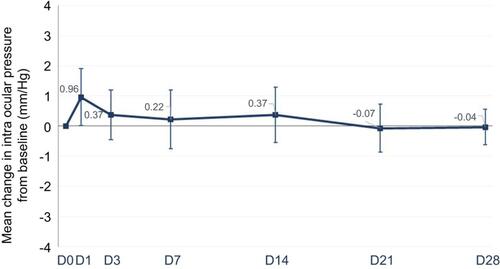
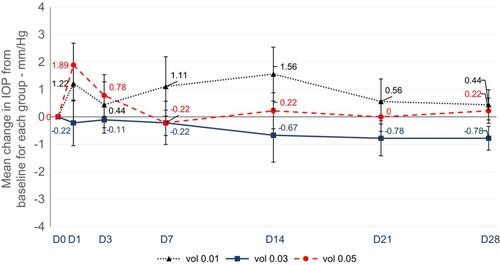
Figure 6 Mean change and 95% CI in intraocular pressure (IOP) from baseline over time for each group, in mmHg.
Abbreviation: D, days after injection.