Figures & data
Figure 1 (A) Multicomponent intraocular lens assembly outside of eye. (B) Multicomponent intraocular lens after in the bag implantation. (C) Front optic being removed from the anterior chamber during the enhancement procedure 3 months after primary implantation using a specially designed Sinsky hook. (D) Front optic component being inserted under the base optic component bridges during the enhancement procedure 3 months after primary implantation. (E) Illustration of the multicomponent intraocular lens. Dark blue schema represents the base lens and the light blue the front lens.
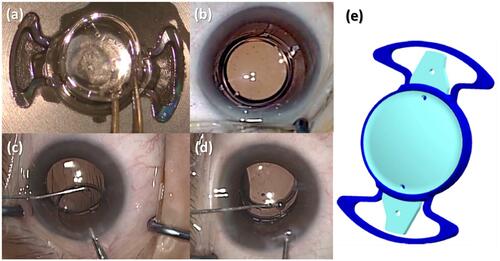
Figure 2 Observation time points during the study.
Abbreviations: PHACO, phacoemulsification and primary implantation of Precisight; P-Op, end of the cataract surgery; 3mo, clinic visit 3 months after the cataract surgery; E-Op, enhancement surgery; 6mo, clinic visit 6 months after the cataract surgery.
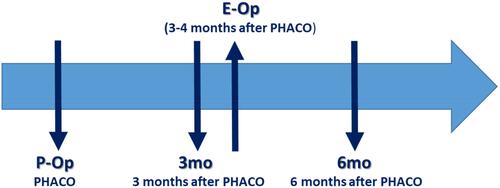
Figure 3 (A) Example of the analysis of the baseline IOL orientation during the cataract surgery using the Matlab script. The yellow line (operating microscope view) is the surgical guidance system (Callisto) horizontal (0 to 180 degree) orientation. The IOL orientation in blue line is the IOL orientation determined by the Callisto software and recalculated and corrected manually if necessary by the Matlab script (Red orientation). The IOL orientation is given by the angle α (diagram). The green line is defined by the center of the lens and a reference point (eg limbal vessel or sclera spot) chosen by the examiner. The β angle is automatically calculated. (B) Example of the analysis of the postoperative IOL orientation based on slit lamp photographs. The IOL orientation is represented in red and is given by the line crossing both manipulation holes (slit lamp view). Then reference point is found by the examiner and the reference orientation (green) is automatically traced. As the β angle is constant in all visits, the postoperative IOL orientation (α’) is automatically obtained (diagram).
Notes: The horizontal orientation (yellow line) of the postoperative visit picture is not shown in the Matlab application but it is automatically calculated using the β angle. The clinical photos shown in (A) and (B) are reproductions of the data analyses from Matlab script.
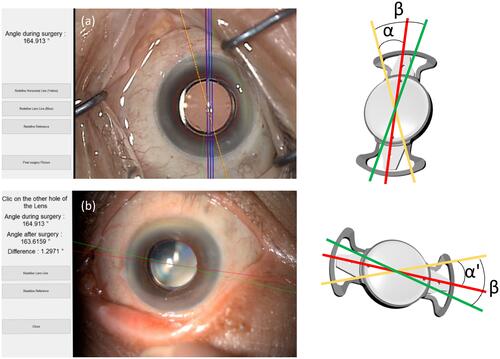
Table 1 Raw data of image analyses in the different follow up visits of two the investigational groups: ENH and PRIM
Table 2 Difference between two analyzed visits in the two groups: ENH and PRIM. Values are Means ± standard deviation (minimum to maximum values)
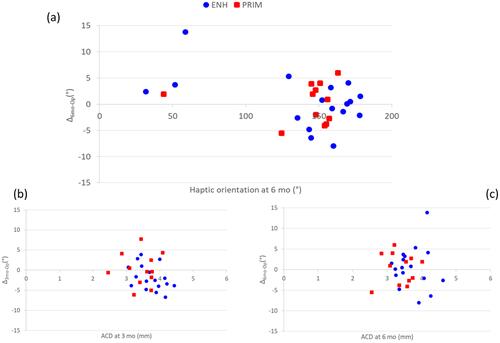
Figure 4 Distribution of the IOL orientation versus the intraocular lens (IOL) rotation at 6 months after cataract surgery. Squared red markers are the PRIM group (N=17) that underwent only the cataract surgery. The round blue markers are the ENH group (N=12) that had an enhancement procedure 3–4 months after the cataract surgery.
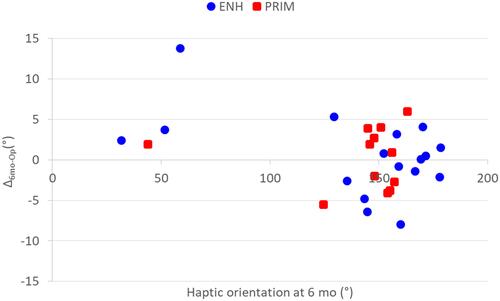
Figure 5 (A) Distribution of the axial length (AL) versus the intraocular lens (IOL) rotation at 6 months after cataract surgery. (B) Distribution of the anterior chamber depth (ACD) versus the intraocular lens (IOL) rotation at 3 months and (C) at 6 months after the cataract surgery. Blue circles refer to the patients that underwent enhancement at 3–4 months after the cataract surgery (ENH, N=17) and the red squares refers to the patients that had only cataract surgery (PRIM, N=12).