
Figures & data
Figure 1 Increasing Ocular Surface Disease Index (OSDI) scores by group (ANOVA; p<0.001).
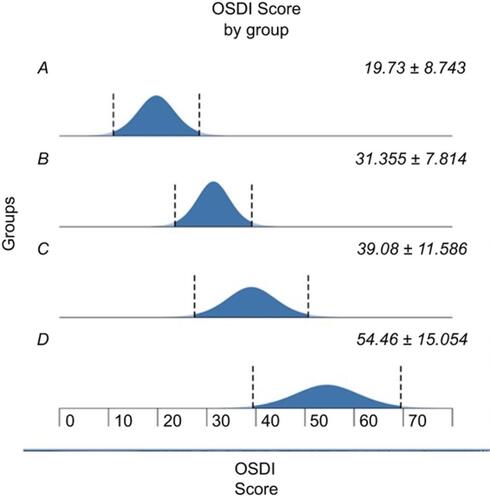
Figure 2 Increasing meibomian gland loss in right lower lid (RLL) by group (ANOVA; p=0.005).
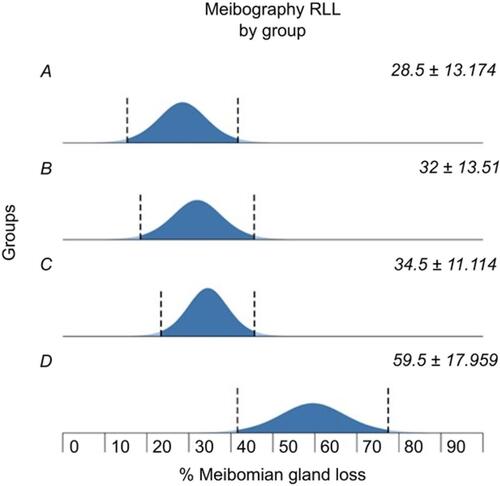
Figure 3 Increasing meibomian gland loss in left upper lid (LUL) by group (ANOVA; p=0.026).
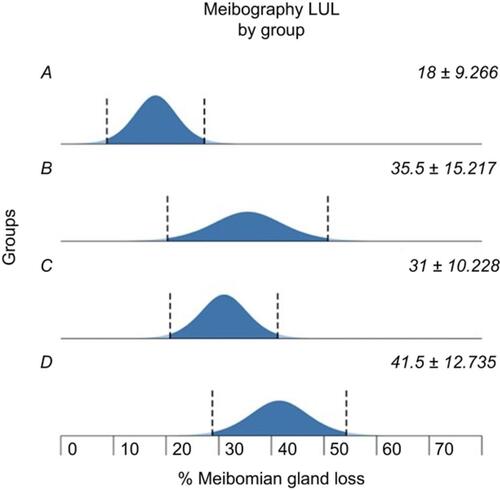
Figure 4 Increasing meibomian gland loss in left lower lid (LLL) by group (ANOVA, p=0.032).
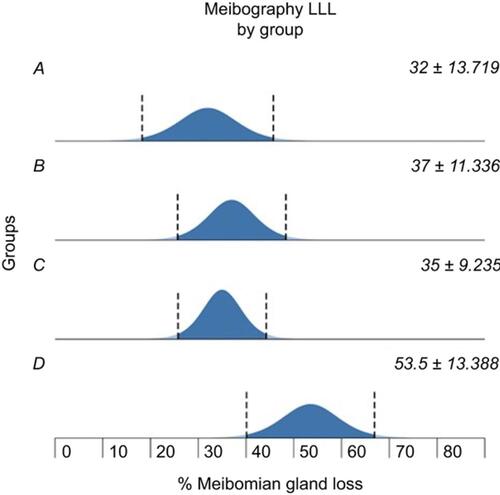
Figure 5 Increasing conjunctival staining across groups, right eye (ANOVA; p=0.004).
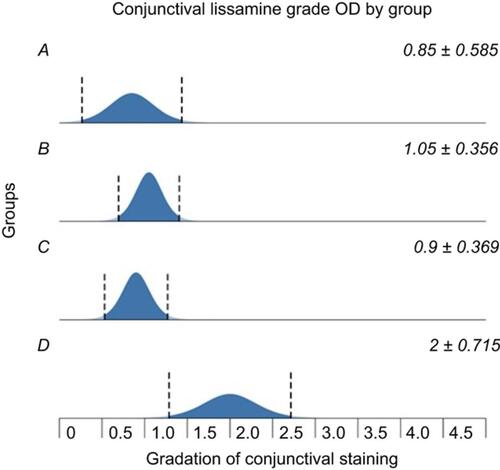
Figure 6 Increasing conjunctival staining across groups, left eye (ANOVA; p=0.041).
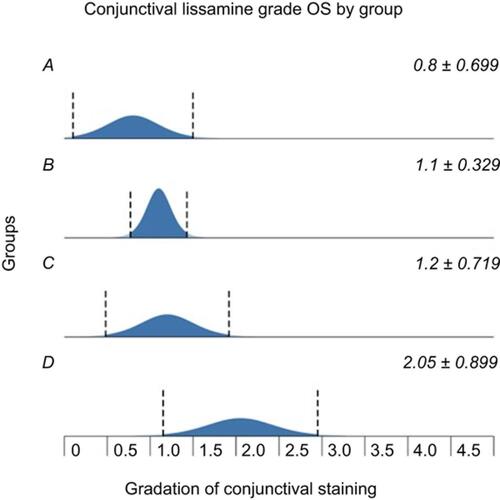
Table 1 Group A results
Table 2 Group B results
Table 3 Group C results
Table 4 Group D results
Table 5 Percentage meibomian gland loss across groups